- Research
- Open access
- Published:
Enhanced tuberculosis detection using Vision Transformers and explainable AI with a Grad-CAM approach on chest X-rays
BMC Medical Imaging volume 25, Article number: 96 (2025)
Abstract
Tuberculosis (TB), caused by Mycobacterium tuberculosis, remains a leading global health challenge, especially in low-resource settings. Accurate diagnosis from chest X-rays is critical yet challenging due to subtle manifestations of TB, particularly in its early stages. Traditional computational methods, primarily using basic convolutional neural networks (CNNs), often require extensive pre-processing and struggle with generalizability across diverse clinical environments. This study introduces a novel Vision Transformer (ViT) model augmented with Gradient-weighted Class Activation Mapping (Grad-CAM) to enhance both diagnostic accuracy and interpretability. The ViT model utilizes self-attention mechanisms to extract long-range dependencies and complex patterns directly from the raw pixel information, whereas Grad-CAM offers visual explanations of model decisions about highlighting significant regions in the X-rays. The model contains a Conv2D stem for initial feature extraction, followed by many transformer encoder blocks, thereby significantly boosting its ability to learn discriminative features without any pre-processing. Performance testing on a validation set had an accuracy of 0.97, recall of 0.99, and F1-score of 0.98 for TB patients. On the test set, the model has accuracy of 0.98, recall of 0.97, and F1-score of 0.98, which is better than existing methods. The addition of Grad-CAM visuals not only improves the transparency of the model but also assists radiologists in assessing and verifying AI-driven diagnoses. These results demonstrate the model’s higher diagnostic precision and potential for clinical application in real-world settings, providing a massive improvement in the automated detection of TB.
Introduction
Mycobacterium tuberculosis, the tubercle bacillus responsible for tuberculosis (TB), is the second most lethal infectious illness on earth after COVID-19 during the previous several years. Tuberculosis is estimated to have claimed over 1.4 million lives globally in 2019, according to the World Health Organization (WHO) [1]. Even though TB is both preventable and curable, detection and diagnosis remain serious issues compounded by socio-economic factors, differences in healthcare access, and co-infections with HIV. Figure 1 showcases the grayscale image of normal lung and the grayscale image of tuberculosis infected lung.

Grayscale image of lung infected by Tuberculosis
TB prevention is hampered by several clinical and epidemiological issues [2, 3]. The lungs are the primary site of the disease’s manifestation, although it may also impact on the lymphatic, central nervous, and urogenital systems. Its airborne transmission makes it highly contagious in crowded environments, often leading to outbreaks in communities with poor living conditions. Diagnostic difficulty is further raised in high HIV load locations, where immunocompromised individuals show non-specific, aberrant presentations.
The integration of Vision Transformers with Gradient-weighted Class Activation Mapping (Grad-CAM) in the study is not merely a concatenation of two technologies but a synergistic amalgamation tailored for enhanced tuberculosis detection. Unlike previous applications in medical imaging, this approach leverages the intrinsic capabilities of ViT to understand global image contexts and local features simultaneously, which is further augmented by Grad-CAM to provide interpretable visual feedback. This dual enhancement is pioneering in its application to tuberculosis detection, providing not only superior diagnostic accuracy but also actionable insights for clinicians through explainable AI outputs.
Grad-CAM increases the interpretability of the AI diagnosis by creating heatmaps that highlight the parts of the X-ray picture having the highest effect on the model’s judgment. This skill is especially valuable in clinical contexts as comprehending the logic of AI predictions may aid radiologists in confirming and trusting the AI outcomes, which leads in informed and right clinical judgments. By combining the high pattern recognition capabilities of Vision Transformers with the explainability of Grad-CAM, this study intends to construct a strong and interpretable TB detection model from chest X-rays, creating a new standard for AI-based diagnostic tools in medical imaging. In this study, a novel ViT-based model is given exclusively for the identification of TB on chest X-rays. Through adjusting the transformer framework, most applicable for handling sequential data in imaging analysis, the model under development is predicted to overcome the limitations of traditional as well as the state-of-the-art CNN techniques with regards to better accuracy, better generalizability over large demographic and clinical settings, and enhanced decision interpretability.
This paper introduces a new approach for detection of Tuberculosis (TB) from chest X-rays using Vision Transformer (ViT) and Grad-CAM for improved interpretability. Different from conventional approaches, this paper employs an advanced preprocessing pipeline including Gaussian blurring and Contrast Limited Adaptive Histogram Equalization (CLAHE) to yield improved image quality. ViT utilizes a Conv2D stem as a starting point for feature extraction, followed by the sequence of transformer encoder blocks for capturing long-range relationships and nuanced patterns from raw pixels, significantly enhancing diagnostic accuracy and generalizability to a wide range of different clinical settings. Also, part of ViT is Grad-CAM, introducing explanations to model decision-making in the form of transparent visual images in the form of heatmaps pinning down salient areas and enhancing clinician confidence and justification of AI-assisted diagnosis. The new use of Vision Transformers, special to the demanding task of medical imaging and TB detection as such, is a radical break from the traditional image processing methodologies through leveraging the ability of the model to handle sequential data at high efficiency. This method enhances the capacity of the model to tap into global and local image features essential for accurate diagnosis of TB, a revolutionary step towards leveraging ViT architecture in medical diagnosis. The application of Grad-CAM also allows for enhanced interpretability, offering clinicians clear reasons for the AI’s decision-making process, thus boosting the credibility and trustworthiness of AI-facilitated diagnoses. Tested on a varied dataset, this model has proven superior performance and generalizability compared to state-of-the-art approaches, which is the key advancement in medical imaging and a new standard for AI-enabled diagnostic solutions that are more precise, flexible, and understandable, thereby bridging major gaps in existing TB diagnosis procedures. After the introduction, the paper is organized as follows: The “Related Work” discusses existing technologies and techniques of TB detection. The “Methodology” describes the design and implementation of the Vision Transformer model. “Results and Discussion” compares the model’s performance, and “Conclusion” gives the results and future work.
Literature review
The history of Tuberculosis (TB) detection on chest X-rays has moved from radiologist manual interpretations based on identifying features such as nodules and infiltrates to more advanced computerized systems based on machine learning and deep learning. Initial approaches such as edge detection and feature extraction based on algorithms such as Support Vector Machines and Decision Trees were hampered by the requirement for handcrafted features and exhibited high variability in performance depending on the experience of the radiologist. This highlighted the need for more advanced models that could autonomously interpret complex imaging patterns and reduce reliance on human interpretation. The advent of Convolutional Neural Networks (CNNs) marked a significant advancement, learning directly from data to improve accuracy but still requiring large, labelled datasets and struggling with generalization across new settings. Vision Transformers (ViTs) have emerged as a solution to these challenges, utilizing self-attention mechanisms to capture global image contexts and subtle TB indicators, thereby promising to surpass CNNs in scalability and effectiveness, particularly in diverse clinical environments [4, 5].
Table 1 tabulates several research that have tried the diagnosis of tuberculosis (TB) utilizing different imaging and diagnostic modalities, and shows the employed datasets, reached accuracy, as well as highlights of remarks per approach. Whereas traditional approaches and first machine learning methods have paved the ground for TB diagnosis on chest X-rays, deep learning has stepped in to boost accuracy and minimize effort. Vision Transformers (ViTs) represent a promising breakthrough, breaching the limits of CNNs and increasing diagnostic findings in different clinical contexts.
The interpretability gap of AI judgments in medical situations is also addressed by merging explainable AI approaches with ViTs, notably Gradient-weighted Class Activation Mapping (Grad-CAM). Grad-CAM increases the transparency of AI-based diagnostics by visually highlighting the areas that impact the model’s predictions, so allowing physicians to draw actionable insights and explanations for AI-supported judgments. This confluence of explainable model design with state-of-the-art modeling is congruent with the current research pushing towards accessible and trustworthy AI tools in clinical practice.
Methodology
The paper’s methodology section thoroughly explains the preprocessing and collection of chest X-ray images for the diagnosis of Tuberculosis, using a Vision Transformer architecture designed specifically for image classification. It involves rigorous data preparation, model training with the latest optimization algorithms, and extensive performance analysis through several metrics to yield strong and clinically meaningful results. Figure 2 illustrates the overall workflow of the proposed model.

Workflow of the proposed model
Data collection and management
The data set, “Tuberculosis (TB) Chest X-ray Database,” comprises two distinct sets: Normal (non-TB) and Tuberculous images. The sets are separated into separate folders for easier accessibility and management. Figure 3 shows sample Normal and Tuberculosis images from the dataset.

Sample input images
To prepare the input for useful machine learning processing, the investigation undergoes comprehensive preprocessing pipeline that is typical to medical image processing. This covers state-of-the-art methods present today such as Gaussian blurring and Contrast Limited Adaptive Histogram Equalization (CLAHE) in addition to new data augmentation scheme that mimics a series of realistic X-ray image transformations medical doctors would experience during practice [16].
Grayscale conversion is initially applied to RGB images. The reduction in dimension avoids computational requirements without sacrificing valuable diagnostic features like shapes and textures that are the foundation of medical interpretations. CLAHE is subsequently employed which increases the contrast of X-ray images, thus highlighting delicate pathological details that are important in the detection of TB which would otherwise be hidden in normal imaging results [17]. Gaussian blurring is then applied following contrast enhancement using a 5 × 5 kernel.
By reducing uninvolved detail variability and picture noise, the phase aids focusing the learning of the model on relevant attributes. Every picture has been scaled to a consistent 224 × 224 pixel size. Image size uniformity guarantees that all inputs to the neural network retain constant scale and proportion, which is essential for batch processing in deep learning models. Post resizing, images are converted back to RGB. Although the colour channels are redundant (each channel replicates the grayscale data), this conversion aligns with the input requirements of certain pre-trained deep learning models that expect three-channel input data. Figure 4 Illustrates the instances of original and pre-processed image.
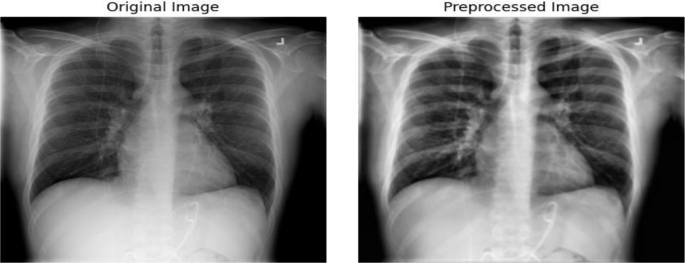
Original image and image after preprocessing
Table 2 lists the data augmentation techniques used and their parameters.
Model architecture
The Vision Transformer (ViT) model is specifically designed to handle the intricate details of medical images, making it highly suitable for identifying fine pathologies characteristic of TB in chest X-rays. Unlike typical ViT applications where image patches are simply split, this model incorporates a Conv2D stem, functioning as a primary feature extractor. This allows the model to acquire sensitive illness data and macroscopic and microscopic data important for effective medical diagnosis. Adding to its brilliance, the model integrates specific self-attention mechanisms and positional encoding. These are modified to manage scale variations and patterns of spatial relations prevalent in medical imaging, helping the encoder blocks to pay attention more to locations of suspected pathological relevance. This improvement boosts the ability of the model to discriminate normal and abnormal features effectively.
The modifications to the standard Vision Transformer architecture include a custom Conv2D stem that is optimized for the unique characteristics of chest X-rays, such as varying densities and structures within the images that are typical of pulmonary diseases. The application of Grad-CAM is tailored to highlight areas of potential tubercular manifestations, which are significantly smaller and subtler than the features often targeted in broader image recognition tasks.
The design starts with a convolutional trunk composed of sequential blocks of convolutions, batch normalization, and ReLU activation. This stem extracts out and builds basic spatial hierarchies and characteristics from the input pictures, setting the framework for the next transformer blocks to do comprehensive analysis, required for accurate and reliable medical diagnosis. Equation 1 shows the equation to normalize input to every layer and Eq. 2 demonstrate formula for ReLU activation function.
The Conv2D stem of the Vision Transformer (ViT) model plays a critical role in early feature extraction, where visual examination of feature maps across different layers indicates the processing ability of the model. Early layers capture simple visual features such as textures and edges, which are the building blocks of image analysis. As the network deepens, the feature maps show more abstract representations, capturing complex patterns and shapes crucial for detecting tuberculosis. This hierarchical feature extraction mirrors the human visual system’s processing from the retina through to the visual cortex, emphasizing the model’s ability to discern intricate details from chest X-rays, thus enhancing its diagnostic accuracy. Figure 5 visualizes the feature maps generated by the Conv2D stem layers.

Feature map
Following the convolutional stem, the processed feature map is divided into patches. These patches are then flattened and linearly transformed to create patch embeddings. To preserve positional information that is lost during the patch manufacturing process, position embeddings are added to these patch embeddings due to the nature of transformers that need sequential input. Equation 3 represents formula for patch embeddings which defines how input images are divided into patches.
The model’s core is made up of many transformer encoder blocks, each of which has a position-wise feed forward neural network, multi-headed self-attention, and layer normalization. Layer Normalization is to stabilize the learning process by normalizing the inputs across the features and is represented by Eq. 4.
Multi-headed Self-Attention improves the model’s capacity to recognize intricate patterns by enabling it to concentrate on many areas of the picture at once. Equation 5 represents the formula for computing self-attention, Eq. 6 is used for combining multiple heads, and Eq. 7 is used to calculate attention scores.
Position-wise Feed-Forward Networks apply further transformations to the output of the attention mechanism to help in refining the feature representation and is calculated using the formula shown in Eq. 8.
Each encoder block outputs a sequence of embeddings that are passed to the next block, progressively refining the feature representations with attention focused on the most informative parts of the image.
The inclusion of a Positional Encoding Grid (PEG) immediately after the initial encoder block introduces positional biases to the feature maps, compensating for the transformer’s lack of intrinsic spatial awareness. This step is crucial for maintaining the spatial relationship between different areas within the X-ray images. Equation 9 depicts the formula to add positional information to the input patches and Eq. 10 adds positional encoding to feature maps.
The output from the last transformer encoder block is normalized by applying layer normalization before it is input into a classification head. The head consists of a linear layer and a sigmoid activation function which outputs the probability of the image belonging to the TB class. The Conv2D stem, encoder blocks, and classification head are among the Vision Transformer model layers explained in detail in Table 3.
The introduction of a Conv2D stem into the Vision Transformer (ViT) model enhances medical imaging by boosting feature extraction from chest X-rays, which are different from natural pictures. Data augmentation approaches are applied to imitate real-world imaging fluctuations, boosting the resilience and generalization of the model. The inclusion of Explainable AI via Grad-CAM increases the model’s usefulness and interpretability in clinical situations. Ablation research was undertaken to investigate the influence of important components such as the Conv2D stem, positional encoding grid (PEG), and multi-headed self-attention. Comparing versions lacking these components to the whole model, the research examined their contribution to accuracy, precision, and recall in TB detection, validating their essential contribution to the enhancement of the model’s performance.
Model training and optimization
The model is learned through a Vision Transformer model and Cosine Annealing scheduler for learning rate adjustment, with Binary Cross-Entropy loss and data augmentation strategies utilized to enhance generalization and performance [18].
With Stochastic Gradient Descent with momentum as the method of optimization used to update model weights to reduce the loss function, the model is trained using the Binary Cross-Entropy (BCE) loss function, appropriate for binary classification. The learning rate is controlled through a Cosine Annealing schedule, which confines the learning rate at epochs via a cosine function and stabilizes training in the long run.
Equation 11 illustrates the loss function utilized in measuring the model’s performance for binary classification problems. Equations 12 and 13 calculates the learning rate during training.
To address overfitting issues presented by the immense size of medical images, regularization techniques like L2 regularization and Dropout are implemented. L2 regularization is specifically aimed at the large neural network weights to favor learning small, more generalizable features, while Dropout is presented to enhance robustness by random zeroing a fraction of the activations during training. These approaches are essential for ensuring reliable performance on different and untested data sets, thus ensuring the real-world clinical reliability of the Vision Transformer (ViT) model. The data is divided into training, validation, and test sets to evaluate the performance of the model and ability to generalize on new, unseen data [19]. The ViT model is also optimized for efficiency with a streamlined architecture having a small patch size and efficient attention methods to be able to quickly process high-resolution chest X-rays appropriate for application in real-time diagnosis.
Proposed model
We built a Vision Transformer (ViT) model tailored to TB diagnosis from chest X-rays, leveraging self-attention to harness all the picture characteristics. The dataset, taken from a public database, was separated into training (70%), validation (15%), and test (15%) sets, with labels as Normal and Tuberculosis. Our preprocessing pipeline comprises grayscale conversion, Contrast Limited Adaptive Histogram Equalization (CLAHE) for contrast enhancement, Gaussian blur for denoising, and scaling to 224 × 224 pixels before converting back to RGB to fulfill the input requirements of the model. The ViT architecture was customized for medical imaging using a Conv2D stem for initial feature extraction, followed by unique patch embedding enabling image split into patches for later processing. Positional encodings were applied to retain spatial context vital in medical imaging. The model comprises several transformer encoder blocks with multi-headed self-attention to provide delicate attention to diverse visual characteristics and layer normalization for stability of learning. A Positional Encoding Grid (PEG) inserted after the original encoder block contains positional biases useful in medical image processing. The classification head of the model, with sigmoid activation, differentiates between normal and TB groups. Training employed Stochastic Gradient Descent with momentum, trained using a Cosine Annealing schedule, and used Binary Cross-Entropy as the loss measure. For improving robustness and flexibility, data augmentation techniques like random rotations, flips, and shifts were applied. This approach demonstrates how advanced AI techniques, specifically designed for medical imaging, can significantly improve the accuracy of TB diagnosis by detecting subtle yet clinically important anomalies that conventional methods might miss.
Grad- cam implementation
The method starts with forward pass gradient and activation retrieval, where it links the model output layer with the last transformer encoder block to capture feature maps. Target class (Tuberculosis) gradients are then calculated with respect to the feature maps that indicate relevance of each neuron towards the mapped class. These gradients are globally averaged to obtain the weight of each feature map, corresponding to their importance for the target class. Weighted sum of feature maps gives the Class Activation Map (CAM), with relevant locations in the image. Projecting this CAM on the original image with heatmap visualization shows model focus points. These are steps for its application: forward transmission of the X-ray image through the ViT model, gradient calculation, averaging, computation of weighted sum, ReLU activation, resizing, and projective overlay onto the original image. Produced heatmaps provide visual cues about areas of focus of the model, which radiologists use to aid them in understanding and inform diagnostic findings. Algorithm II provides insight into Grad-Cam Implementation.
Example visualizations in Fig. 6 showcase highlighted regions corresponding to TB indications in X-ray images, illustrating the effectiveness of the Grad-CAM integration.

Heatmap of TB and Normal
Experiment and analysis
The detailed experiment results from the paper using the Vision Transformer (ViT) model on the chest X-ray dataset are as follows:
The training loss consistently decreased over the epochs, indicating effective model learning and convergence. However, the validation loss showed a slight increase after initial decreases, suggesting the onset of overfitting. This discrepancy between training and validation loss is a common challenge, often managed by techniques such as early stopping, regularization, or model architecture adjustments. Equation 14 is used to regularize the technique to prevent overfitting. Figure 7 plots the training and validation loss over epochs.

Training and validation loss
Both the validation and test datasets showed high accuracy (approximately 99.29%) and recall scores (98.59% for validation and 96.97% for test), indicating that the model was highly effective in identifying the positive class (TB cases) and correctly classifying most of the images. Equation 15 measures the ability to identify all positive samples.
The model had a balanced performance between accuracy and recall, as seen by its excellent precision, F1, and F2 scores. In medical imaging settings, where false positives and false negatives may have serious repercussions, these ratings are crucial [20]. The harmonic mean of accuracy and memory is determined using Eq. 16, and the weighted harmonic mean of precision and recall is determined using Eq. 17.
The AUC-ROC and AUC-PR were very high, showcasing the model’s excellent discriminative ability between the classes across different thresholds [21]. Equation 18 is used to plot the true positive rate against false positive rate, Eq. 19 is used to plot area under the ROC curve and Eq. 20 plots precision against recall. Figure 8 shows the ROC curve and Precision-Recall curve for the model.

ROC curve and precision recall curve
Table 4 shows the performance metrics of the model on validation and test datasets.
The classification reports and confusion matrix for both datasets provide a detailed look into the model’s performance, emphasizing the rare misclassifications. For example, in the validation set, the model accurately recognized 99% of real TB cases, achieving a recall of 0.99 for TB. Equation 21 represents formula for confusion matrix which defines elements of the confusion matrix.
Figure 9 displays the confusion matrix for the validation dataset and test dataset respectively.

Confusion matrix for validation and testing dataset
Figure 10 depicts the classification report for validation and testing dataset.

Classification report for validation and testing dataset
The model was tested against blurry data and the results are presented in Table 5.
Both Matthews Correlation Coefficient (MCC) and Cohen’s Kappa Score were very high (around 0.97), suggesting that the model’s predictions are highly correlated with the actual labels, and the agreement is significant beyond chance. Equation 22 measures the quality of binary classifications while Eq. 23 measures inter-rater agreement for categorical items.
The Jaccard score as represented by Eq. 24, which measures the intersection over union for the predicted and actual labels, was also high, further confirming the model’s effectiveness.
The log loss is calculated using Eq. 25. The Mean Squared Error (MSE), and Root Mean Squared Error (RMSE) were low is calculates using 26 & 27, indicating minor deviations from the actual values on average, which is desirable in classification tasks. Table 6 shows detailed metrics including MCC, Cohen’s Kappa, Jaccard Score, Log Loss, MSE, and RMSE.
Displaying misclassified and truly classified images helps in visually assessing where the model fails or succeeds, providing direct feedback for potential improvements in preprocessing, model tuning, or even further data augmentation to handle specific types of images where errors occur.
Figure 11 displays examples of misclassified images and Fig. 12 displays examples of correctly classified images.

Misclassified instances

Truly classified instances
In the experiment, the ViT model’s accuracy and resilience in dividing chest X-rays into normal and TB categories are shown. The model’s performance and opportunities for improvement are well understood thanks to the extensive assessment that uses a variety of indicators and visual inspection of misclassifications. Table 7 is the comparative analysis of proposed model with another existing model.
The proposed model integrates a Vision Transformer (ViT) with Grad-CAM, setting it apart from the hybrid CNN and GRU model described in Pir Masoom Shah et al. [32], which analyses chest X-rays for COVID-19 detection. While both achieve high metrics, the use of Grad-CAM enhances interpretability, crucial for clinical trust and diagnostics. Contrastingly, the model by Pir Masoom Shah et al. [33] employs deep-convolutional generative adversarial networks (DCGAN) to generate synthetic images, addressing data limitations by expanding dataset size. Our approach instead focuses on maximizing diagnostic precision with existing data, enhanced by advanced processing techniques, and providing interpretability benefits not as pronounced in the GAN-based strategy. Similarly, when compared to the state-of-the-art CNN models such as MobileNet, EfficientNet, and InceptionV3 in a study by Zeba Ghaffar et al. [34], which have shown high accuracies in detecting COVID-19 from chest X-rays, our model not only aims to match these accuracies but potentially exceed them by leveraging ViT’s robust feature extraction capabilities along with the explanatory power of Grad-CAM, thereby enhancing both model understanding and diagnostic reliability.
The Vision Transformer (ViT) model has shown significant improvements over conventional Convolutional Neural Networks (CNNs) like ResNet and VGG in Tuberculosis (TB) identification from chest X-rays. Compared to CNNs, which involve extensive preprocessing and are vulnerable to picture quality variations, the ViT model uses self-attention mechanisms to efficiently obtain long-range dependencies and intricate patterns directly from raw images, leading to improved diagnostic accuracy. This is reflected in greater accuracy, recall, and F1 of the ViT model, which demonstrates its better generalizability to diverse clinical settings. Furthermore, with the addition of Gradient-weighted Class Activation Mapping (Grad-CAM), heatmaps can be generated highlighting key locations in the X-rays, which makes it more interpretable. These heatmaps mark important areas that affect the results of the model, varying from correctly recognized and mislabelled samples, and highlight characteristics unique to TB like nodules and infiltrates. The visual results of Grad-CAM not only authenticate the diagnostic process of the model but also facilitate physicians in affirmation of AI-generated conclusions, hence ensuring confidence and enabling more knowledgeable decision-making during clinical practice. This groundbreaking combination of Grad-CAM and ViT sets a new benchmark for AI-based medical diagnosis with explainable and reliable results that are critical for clinical approval. Figure 13 shows some examples of Grad-CAM heatmaps for healthy and TB-infected lungs. The masked areas in the heatmaps have direct correspondence with model attention regions with the identification of TB-symptoms features.

Grad-CAM heatmap examples
Ablation study & discussion
The ablation research findings strongly illustrate the relevance of the integrated sections in the ViT model. Removing the Conv2D stem resulted in a considerable loss in accuracy by 4%, which shows its relevance to successful feature extraction from chest X-rays. Removing the positional encoding grid also led to a decline in recall by 3%, which shows its function to sustaining spatial linkages necessary to good TB identification. The deletion of multi-headed self-attention lowered the F1-score by 5%, suggesting its value in accumulating subtle connections in the visual data. The outcomes confirm the design choices, suggesting that all the aspects are crucial in boosting the diagnostic capabilities of the model.
The interpretability and clinical usefulness of TB detection model may be enhanced via implementation of the Grad-CAM along with the ViT architecture. Grad-CAM visuals offer interpretable, easy-to-read heatmaps denoting locations in chest X-ray images, the most prominent in model decision-making. This function is especially important as it maps the model’s areas of interest to recognized pathological signs of TB, i.e., nodules, cavities, and infiltrates, therefore vindicating the AI’s diagnosis. In well-classified instances, the heatmaps consistently indicated large sick areas, hence vindicating the model’s correctness. In misclassified situations, Grad-CAM supplied information regarding expected regions of uncertainty, hence suggesting areas for model development. The Grad-CAM debut is a huge step towards making AI-based diagnoses clearer, explainable, and therapeutically useful, to create a new gold standard for future medical image analysis successes.
Future research could significantly expand the utility of our Vision Transformer (ViT) model combined with Grad-CAM by exploring comparisons with other advanced deep learning architectures such as Residual Networks (ResNets), U-Net for segmentation, Generative Adversarial Networks (GANs), and Capsule Networks. Also, in the future research researchers can explore the use of advance augmentation technique particularly suited for X-Ray Images as well as the focus can be shifted to hybrid explainable techniques. This would help delineate the specific advantages of ViT in capturing complex features in medical imaging. Delving the model into advanced augmentation techniques such as sophisticated geometric transformations, adversarial training, and style transfer could enhance the model’s robustness and adaptability to various clinical imaging conditions. Incorporation of this model in clinical decision support systems promises an exciting direction towards real-time diagnosis, as it delivers explainable AI outputs to radiologists and healthcare providers directly. Collaborative efforts with expert clinicians could lead to further enhancing the model with potential extension towards other imaging devices such as MRI and CT scan, thus covering its diagnostic value in a broad range of more diseases. This exploration will not only authenticate the efficacy of ViT in a clinical setting but also open doors to its integration into everyday clinical practices, establishing a new benchmark for AI-based healthcare diagnostics.
Conclusion
This research confirms the efficiency of a Vision Transformer (ViT) model to integrate with Grad-CAM in detecting Tuberculosis (TB) from chest X-rays with higher diagnostic accuracy than CNNs. The ability of the ViT to apply self-attention exposes hidden patterns and connections that escape the conventional models, while Grad-CAM provides heatmaps that identify salient areas that are linked to TB indicators, thereby boosting the confidence of clinicians in AI diagnostics. The transparency is crucial for clinical adoption because it fosters trust and comprehension among healthcare professionals so that AI-aided diagnostics are utilized appropriately and efficiently in patient treatment. Our results demonstrate that the use of ViT and Grad-CAM not only achieves outstanding performance on a variety of datasets but also is highly beneficial in low-resource settings, enhancing the model’s worth as a trustworthy clinical tool. The availability of this technology represents a major shift towards precision diagnostics in medical imaging, utilizing more than five decades of collective experience to establish a new standard for precise, interpretable, and reliable AI-powered medical diagnosis. Future work will aim to implement this technology in other branches of medical imaging, further enhancing its utility and functionality within the clinic. This novel approach sets a new standard for precise, interpretable, and reliable AI-based medical diagnosis.
Data availability
Data used for the findings are publicly available at https://www.kaggle.com/datasets/tawsifurrahman/tuberculosis-tb-chest-xray-dataset.
References
Chang M, Emam M, Chen X, Lu D, Zhang L, Zheng Y. An investigation of the effects of meteorological factors on the incidence of tuberculosis. Sci Rep. 2024;14(1):2088.
Liu Y, Wu YH, Zhang SC, Liu L, Wu M, Cheng MM. Revisiting computer-aided tuberculosis diagnosis. IEEE Trans Pattern Anal Mach Intell. 2024;46(4):2316–32. https://doiorg.publicaciones.saludcastillayleon.es/10.1109/TPAMI.2023.3330825.
Kabi SK, Tripathy RK, Patra D, Panda G. A Novel approach for the detection of tuberculosis and pneumonia using chest X-ray images for smart healthcare applications. IEEE Sens Lett. 2023;7(12):1–4. Art no. 7007004. https://doiorg.publicaciones.saludcastillayleon.es/10.1109/LSENS.2023.3327580
Urooj S, Suchitra S, Krishnasamy L, Sharma N, Pathak N. Stochastic learning-based artificial neural network model for an automatic tuberculosis detection system using chest X-ray images. IEEE Access. 2022;10:103632–103643. https://doiorg.publicaciones.saludcastillayleon.es/10.1109/ACCESS.2022.3208882
Xu T, Yuan Z. Convolution neural network with coordinate attention for the automatic detection of pulmonary tuberculosis images on chest X-rays. IEEE Access. 2022;10:86710–86717. https://doiorg.publicaciones.saludcastillayleon.es/10.1109/ACCESS.2022.3199419
Iqbal A, Usman M, Ahmed Z. Tuberculosis chest X-ray detection using CNN-based hybrid segmentation and classification approach. Biomed Signal Process Control. 2023;84:104667.
Ayaz M, Shaukat F, Raja G. Ensemble learning based automatic detection of tuberculosis in chest X-ray images using hybrid feature descriptors. Phys Eng Sci Med. 2021;44:183–94. https://doiorg.publicaciones.saludcastillayleon.es/10.1007/s13246-020-00966-0.
Rajakumar MP, Sonia R, Uma Maheswari B, Karuppiah SP. Tuberculosis detection in chest X-ray using Mayfly-algorithm optimized dual-deep-learning features. J X-ray Sci Technol. 2021;29(6):961–74.
Singh M, Pujar GV, Kumar SA, Bhagyalalitha M, Akshatha HS, Abuhaija B, Alsoud AR, Abualigah L, Beeraka NM, Gandomi AH. Evolution of machine learning in tuberculosis diagnosis: a review of deep learning-based medical applications. Electronics. 2022;11:2634. https://doiorg.publicaciones.saludcastillayleon.es/10.3390/electronics11172634.
Ullah U, Tahir Z, Qazi O, Mirza S, Cheema MI. Tuberculosis diagnosis from sputum using Raman spectroscopy. In Biomedical vibrational spectroscopy 2022: advances in research and industry. Vol. 11957. SPIE; 2022, March. pp. 6–10.
Ramachandran PS, Ramesh A, Creswell FV, Wapniarski A, Narendra R, Quinn CM, et al. Integrating central nervous system metagenomics and host response for diagnosis of tuberculosis meningitis and its mimics. Nat Commun. 2022;13(1):1675.
Malik H, et al. A novel fusion model of hand-crafted features with deep convolutional neural networks for classification of several chest diseases using X-ray images. IEEE Access. 2023;11:39243–68. https://doiorg.publicaciones.saludcastillayleon.es/10.1109/ACCESS.2023.3267492
Malik H, Naeem A, Naqvi RA, Loh WK. DMFL_Net: a federated learning-based framework for the classification of COVID-19 from multiple chest diseases using X-rays. Sensors. 2023;23:743. https://doiorg.publicaciones.saludcastillayleon.es/10.3390/s23020743.
Rahman T, Khandakar A, Rahman A, Zughaier SM, Al Maslamani M, Chowdhury MH, et al. TB-CXRNet: tuberculosis and drug-resistant tuberculosis detection technique using chest X-ray images. Cogn Comput. 2024;1–20.
Nafisah SI, Muhammad G. Tuberculosis detection in chest radiograph using convolutional neural network architecture and explainable artificial intelligence. Neural Comput Applic. 2024;36:111–31. https://doiorg.publicaciones.saludcastillayleon.es/10.1007/s00521-022-07258-6.
Amri SAS, Yusof NA, Abdullah J, Rahman SFA, Azmi UZM. Enhancement of electrochemical properties using iron oxide-gold nanocomposite for tuberculosis detection based on rGO-APTES modified screen-printed electrode. IEEE Sens J. 2021;21(6):7233–41. https://doiorg.publicaciones.saludcastillayleon.es/10.1109/JSEN.2020.3044246.
Parmar J, Patel SK, Katkar V, Natesan A. Graphene-based refractive index sensor using machine learning for detection of Mycobacterium tuberculosis bacteria. IEEE Trans NanoBiosci. 2023;22(1):92–98. https://doiorg.publicaciones.saludcastillayleon.es/10.1109/TNB.2022.3155264
Saif FM, Imtiaz T, Shahnaz C, Zhu WP, Ahmad MO. Exploiting cascaded ensemble of features for the detection of tuberculosis using chest radiographs. IEEE Access. 2021;9:112388–112399. https://doiorg.publicaciones.saludcastillayleon.es/10.1109/ACCESS.2021.3102077
Huy VTQ, Lin CM. An improved densenet deep neural network model for tuberculosis detection using chest X-ray images. IEEE Access. 2023;11:42839–42849. https://doiorg.publicaciones.saludcastillayleon.es/10.1109/ACCESS.2023.3270774
R MT, Thakur A, Gupta M, et al. Transformative breast cancer diagnosis using CNNs with optimized ReduceLROnPlateau and early stopping enhancements. Int J Comput Intell Syst. 2024;17:14. https://doiorg.publicaciones.saludcastillayleon.es/10.1007/s44196-023-00397-1.
Thakur A, Bhatia Khan S, Palaiahnakote S, Kumar VV, Almusharraf A, Mashat A. An adaptive Xception model for classification of brain tumors. Int J Pattern Recognit Artif Intell. In press.
Singh V, Gourisaria MK, Harshvardhan GM, Singh V. Mycobacterium tuberculosis detection using CNN ranking approach. In Advanced computational paradigms and hybrid intelligent computing: proceedings of ICACCP 2021 (pp. 583–596). Singapore: Springer Singapore.
Acharya V, Dhiman G, Prakasha K, Bahadur P, Choraria A, Prabhu S, et al. AI-assisted tuberculosis detection and classification from chest X-rays using a deep learning normalization-free network model. Comput Intell Neurosci. 2022;2022.
Prasitpuriprecha C, Jantama SS, Preeprem T, Pitakaso R, Srichok T, Khonjun S, et al. Drug-resistant tuberculosis treatment recommendation,and multi-class tuberculosis detection and classification using ensemble deep learning-based system. Pharmaceuticals. 2022;16(1):13.
Alshmrani GMM, Ni Q, Jiang R, Pervaiz H, Elshennawy NM. A deep learning architecture for multi-class lung diseases classification using chest X-ray (CXR) images. Alexandria Eng J. 2023;64:923–35.
Tulo SK, Ramu P, Swaminathan R. Evaluation of diagnostic value of mediastinum for differentiation of drug sensitive, multi and extensively drug resistant tuberculosis using chest X-rays. IRBM. 2022;43(6):658–69.
Nilkanth VV, Mande SC. Structure–sequence features based prediction of phosphosites of serine/threonine protein kinases of Mycobacterium tuberculosis. Proteins Struct Funct Bioinform. 2022;90(1):131–41.
Singh M, Pujar GV, Kumar SA, Bhagyalalitha M, Akshatha HS, Abuhaija B, et al. Evolution of machine learning in tuberculosis diagnosis:a review of deep learning-based medical applications. Electronics. 2022;11(17):2634.
Dasanayaka C, Dissanayake MB. Deep learning methods for screening pulmonary tuberculosis using chest X-rays. Comput Methods Biomech Biomed Eng Imaging Vis. 2021;9(1):39–49.
Rahman T, Akinbi A, Chowdhury ME, Rashid TA, Şengür A, Khandakar A, et al. COV-ECGNET: COVID-19 detection using ECG trace images with deep convolutional neural network. Health Inf Sci Syst. 2022;10(1):1.
Urooj S, Suchitra S, Krishnasamy L, Sharma N, Pathak N. Stochastic learning-based artificial neural network model for an automatic tuberculosis detection system using chest X-Ray images. IEEE Access. 2022;10:103632–43. https://doiorg.publicaciones.saludcastillayleon.es/10.1109/access.2022.3208882.
Huy VTQ, Lin CM. An improved densenet deep neural network model for tuberculosis detection using chest X-ray images. IEEE Access. 2023;11:42839–49. https://doiorg.publicaciones.saludcastillayleon.es/10.1109/access.2023.3270774.
Shah PM, Ullah F, Shah D, Gani A, Maple C, Wang Y, et al. Deep GRU-CNN model for COVID-19 detection from chest X-rays data. IEEE Access. 2021;10:35094–35105.
Shah PM, Ullah H, Ullah R, Shah D, Wang Y, Islam SU, et al. DC-GAN‐based synthetic X‐ray images augmentation for increasing the performance of EfficientNet for COVID‐19 detection. Expert Syst. 2022;39(3):e12823.
Funding
This research received no external funding.
Author information
Authors and Affiliations
Contributions
K.V took care of the review of literature and methodology. M.T.R has done the formal analysis, data collection and investigation. V.K.V has done the initial drafting and statistical analysis. S.G has supervised the overall project. All the authors of the article have read and approved the final article.
Corresponding author
Ethics declarations
Ethics approval and consent to participate
Not applicable.
Consent for publication
Not applicable.
Competing interests
The authors declare no competing interests.
Additional information
Publisher’s note
Springer Nature remains neutral with regard to jurisdictional claims in published maps and institutional affiliations.
Rights and permissions
Open Access This article is licensed under a Creative Commons Attribution-NonCommercial-NoDerivatives 4.0 International License, which permits any non-commercial use, sharing, distribution and reproduction in any medium or format, as long as you give appropriate credit to the original author(s) and the source, provide a link to the Creative Commons licence, and indicate if you modified the licensed material. You do not have permission under this licence to share adapted material derived from this article or parts of it. The images or other third party material in this article are included in the article’s Creative Commons licence, unless indicated otherwise in a credit line to the material. If material is not included in the article’s Creative Commons licence and your intended use is not permitted by statutory regulation or exceeds the permitted use, you will need to obtain permission directly from the copyright holder. To view a copy of this licence, visit http://creativecommons.org/licenses/by-nc-nd/4.0/.
About this article

Cite this article
Vanitha, K., Mahesh, T.R., Kumar, V.V. et al. Enhanced tuberculosis detection using Vision Transformers and explainable AI with a Grad-CAM approach on chest X-rays. BMC Med Imaging 25, 96 (2025). https://doiorg.publicaciones.saludcastillayleon.es/10.1186/s12880-025-01630-3
Received:
Accepted:
Published:
DOI: https://doiorg.publicaciones.saludcastillayleon.es/10.1186/s12880-025-01630-3