- Research
- Open access
- Published:
Radiomic analysis using T1 mapping in gadoxetic acid disodium-enhanced MRI for liver function assessment
BMC Medical Imaging volume 25, Article number: 111 (2025)
Abstract
Objectives
To explore the value of a T1 mapping-based radiomic model for evaluating liver function.
Methods
From September 2020 to October 2022, 163 patients were retrospectively recruited and categorized into normal liver function group, chronic liver disease group without cirrhosis, Child‒Pugh class A group, and Child‒Pugh class B and C group. Patients were randomly split into training and testing sets. Radiomic features were extracted from T1 mapping images taken both pre- and post-contrast injection, as well as during the hepatobiliary phase (HBP). Radiomic models were constructed to stratify chronic liver disease, cirrhosis and decompensated cirrhosis. Model performance was assessed with receiver operating characteristic curve analysis, and decision curve analysis.
Results
The K-Nearest Neighbors model demonstrated the best generalization across native T1 map, HBP T1 maps and HBP images. In the training set, based on native T1 maps, it achieved accuracies of 0.83, 0.86, and 0.86 in distinguishing chronic liver disease, cirrhosis, and decompensated cirrhosis, with corresponding AUCs of 0.92, 0.92, and 0.95. In the testing set, the accuracies were 0.75, 0.89, and 0.71, with AUCs of 0.79, 0.92, and 0.83, respectively. When using HBP images with T1 maps, the accuracies were 0.72, 0.90, and 0.72 in the testing set in identifying chronic liver disease, cirrhosis, and decompensated cirrhosis with AUCs of 0.82, 0.93, and 0.79, respectively.
Conclusion
Radiomic analysis based on native T1 map, and HBP with or without T1 map images shows promising potential for liver function assessment, particularly in distinguishing cirrhosis.
Introduction
Chronic liver disease, including liver cirrhosis, imposes a heavy global health burden and is one of the leading causes of mortality, accounting for approximately 2 million deaths annually [1]. Accurate liver function assessment is essential for prognosis prediction, treatment guidance, and presurgical planning, particularly for liver malignancies. There is a growing demand for precise, quantitative liver function evaluation in clinical practice.
Currently, liver function is commonly assessed using biochemical markers and clinical scoring systems such as the Child‒Pugh classification, Model for End-Stage Liver Disease (MELD) score, and the indocyanine green (ICG) clearing test [2]. However, each of these methods has inherent limitations. The Child‒Pugh score incorporates subjective clinical parameters, such as ascites and hepatic encephalopathy, potentially leading to interobserver variability. The MELD score, though objective, is primarily for end-stage liver disease and lacks sensitivity for detecting early-stage cirrhosis. The ICG test, though providing a quantitative measure of hepatic uptake function, is invasive and sensitive to hemodynamic changes and fails to reflect the heterogeneity of regional hepatic function. These limitations highlight the need for alternative, imaging-based quantitative liver function assessment methods.
Gadoxetic acid disodium (Gd-EOB-DTPA)-enhanced magnetic resonance imaging (EOB-MRI) has emerged as a promising imaging modality for liver function evaluation. Gd-EOB-DTPA is a hepatocyte-specific contrast agent that is taken up by hepatocytes via organic anion-transporting polypeptides (OATPs) and excreted into the bile through multidrug-resistant proteins (MRPs), simulating bile excretion [3,4,5]. The resulting hepatobiliary phase (HBP) images provide functional insights into hepatocellular uptake and biliary excretion. With the use of T1 mapping, it enables direct measurement of SI of the images [6,7,8,9,10,11,12,13]. However, the utility of native T1 mapping for assessing liver function remains debated. Some studies [14, 15] have shown a negative correlation between pre-contrast T1 relaxation time (T1pre) and liver function, while others have reported paradoxical changes, raising concerns about its consistency and clinical applicability [7, 14, 15].
Radiomics enables high-throughput feature extraction and quantitative analysis of medical images [16] that has been applied to the diagnosis, treatment evaluation and prognosis prediction of various diseases. Thüring et al. used machine learning models based on multiphase CT images in assessing Child-Pugh class, and the CNN model performs comparable to experienced radiologists [17]. Zhang et al. utilized a radiomic nomogram based on R2* mapping and clinical biomarkers to stage liver fibrosis, showing promising results in identifying significant fibrosis, advanced fibrosis, and cirrhosis [18]. Until now, no studies have yet applied MRI-based T1 mapping with radiomics to assess liver function.
Therefore, this study aims to explore the potential of native T1 mapping-based radiomics in quantitative assessment of liver function and to evaluate its added value to HBP imaging compared to HBP imaging alone.
Materials and methods
Patients
This study was approved by the hospital’s Ethics Committee on Human Research, with a waiver for informed consent. A total of 269 patients who underwent EOB-MRI of the liver at our hospital from September 2020 to October 2022 were retrospectively recruited. The inclusion criteria included patients with chronic hepatitis B, with or without cirrhosis, as well as individuals without chronic liver disease who had suspected focal liver lesions requiring MRI, serving as the normal liver function (NLF)group. Of these, 106 (57 males and 49 females) were excluded for the following reasons: (1) diffuse or multiple lesions (n = 22); (2) prior partial hepatectomy (n = 20); (3) prior spleen resection (n = 13); (4) biliary obstruction; (n = 18); (5) severe fatty liver (n = 20); and (6) significant image artifacts (n = 13). A total of 163 patients (117 males and 46 females) were ultimately included in the study, with the patient selection process outlined in Fig. 1. Clinical and laboratory data collected included sex, age, hepatitis type, total bilirubin, prothrombin time, and Child‒Pugh class. The patients were separated into four groups: the NLF, chronic liver disease (CLD) without cirrhosis (hereafter, CLD refers specifically to chronic liver disease without cirrhosis), Child-Pugh class A (CPA), and Child-Pugh class B and C (CPBC). Subsequently, the patients were randomly split into a training set (n = 114) and a test set (n = 49) at a ratio of 7:3 for three stratified classification tasks:
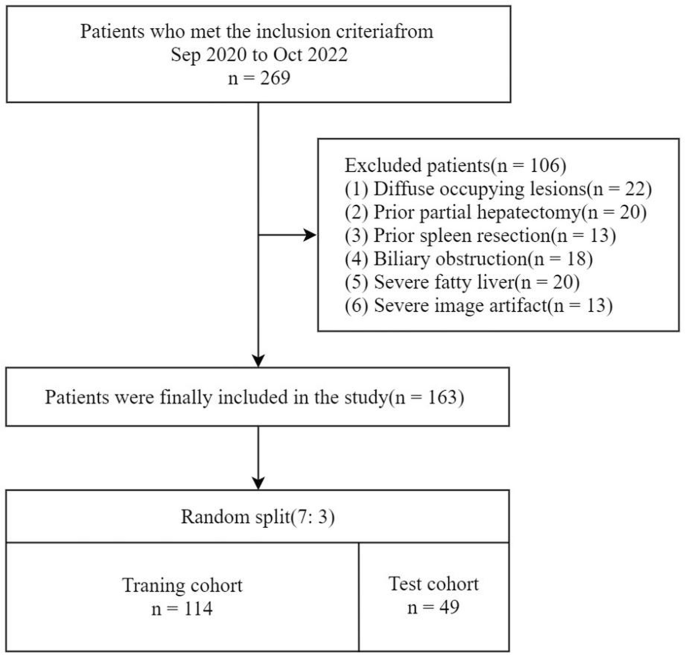
Flow diagram of the study population
-
Task 1, for distinguishing chronic liver disease: NLF vs. (CLD + CPA + Child–Pugh class B and C (CPBC))
-
Task 2, for distinguishing cirrhosis: (NLF + CLD) vs. (CPA + CPBC)
-
Task 3, for distinguishing decompensated cirrhosis: (NLF + CLD + CPA) vs. CPBC.
MR protocol
MRI examinations were performed on a 3.0T scanner (Magnetom Prisma, Siemens Healthineers, Erlangen, Germany) with an 18-channel body phased array coil. All patients underwent epigastric EOB-MRI scanning. Gd-EOB-DTPA (Primovist, Bayer Schering Pharma, Berlin, Germany) was administered intravenously at a dose of 0.025 mmol/kg, with a rate of 1.0 mL/s, followed by a 20 mL saline flush at the same rate. T1 mapping images were acquired before and 20 min after contrast injection (i.e., during the hepatobiliary phase or HBP), while T1-weighted images were acquired during the HBP without T1 mapping. A rapid three-dimensional volumetric interpolated breath-hold examination sequence was acquired to obtain whole-liver volume T1 mapping images in one breath-hold (13–20 s). Before the T1 mapping sequence, automatic correction was performed with a B1 mapping pulse sequence. The parameters for the T1 mapping were: flip angle = 3°, 15°, inversion time (TI) = 800 msec, repetition time (TR) = 5.01 msec, echo time (TE) = 2.3 msec, scan matrix = 224 × 168 × 112, field-of-view (FOV) = 380 mm×305 mm, layer thickness = 4 mm, and interval = 0.8 mm. The T1-weighted scan parameters were as follows: flip angle = 9°, TR = 3.37 msec, TE = 1.33 msec, scan matrix = 352 × 250 × 176, FOV = 380 mm×320 mm, layer thickness = 3 mm, and interval = 0.6 mm.
Image segmentation
Native T1 maps, HBP T1 maps, and HBP images were retrieved for radiomic analysis. The analysis focused on these specific imaging modalities due to their relevance in assessing liver tissues and their capability to highlight pathological changes that are not easily visible in other imaging sequences. Two experienced radiologists, each with over eight years of specialization in abdominal MRI, manually delineated the regions of interest (ROIs) using the InferScholar Center platform (http://research.infervision.com/v2/, InferVision). ROIs were delineated as shown in Fig. 2, avoiding focal liver lesions, major bile duct branches, and hepatic vessels. The segmentation included the left lateral lobe, left medial lobe, right anterior lobe, and right posterior lobe of the liver, each with an area of approximately 100 mm2. Interobserver reproducibility was evaluated using the intraclass correlation coefficient (ICC). Features were selected based on their ICC values, with those exhibiting ICCs above 0.75 chosen for further feature transformation to ensure high consistency across different groups. This decision was informed by the widely accepted guidelines on ICC interpretation, which categorize values above 0.75 as indicative of ‘good’ to ‘excellent’ reliability [19].
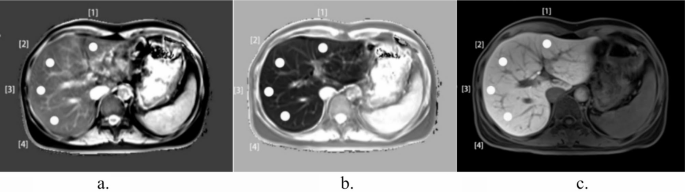
Examples of ROIs depicted on native T1 map (a), HBP T1 map (b) and HBP images (c). A 65-year-old patient with chronic hepatitis B viral hepatitis for 8 years and liver cirrhosis with Child–Pugh class B. ROI: region of interest, HBP: hepatobiliary phase, T1: T1 relaxation time
Radiomic feature extraction, selection and model Building
The InferScholar Center platform (http://research.infervision.com/v2/, InferVision) was used for normalization, radiomic feature extraction, selection and model building. All images were normalized using z-score normalization before radiomic feature extraction. Radiomic features were automatically extracted from each segmented ROI following image segmentation. The radiomic features evaluated in this study were categorized into several types: first-order statistics, 2D shape descriptors, and texture features including the gray-level co-occurrence matrix (GLCM), gray-level size-zone matrix (GLSZM), gray-level run-length matrix (GLRLM), neighborhood gray-tone difference matrix (NGTDM), and gray-level dependence matrix (GLDM). Additionally, a variety of filters—Original, Wavelet, Laplacian of Gaussian (LoG), Square, Square Root, Logarithm, Exponential, and Gradient were applied to enhance the feature extraction process. These methodologies were employed to facilitate a comprehensive analysis of the imaging data, aiming to capture a broad spectrum of information pertinent to the underlying pathology.
The feature selection process was conducted in multiple steps to ensure the relevance, independence, and robustness of the selected features. First, Spearman correlation analysis was employed to exclude features exhibiting high correlation (correlation coefficient > 0.85). Subsequently, univariate analysis was performed to identify features demonstrating statistically significant differences among the groups (p < 0.05). Feature selection was further refined using the least absolute shrinkage and selection operator (LASSO) logistic regression, combined with 5-fold cross-validation. Radiomic models were then developed using several algorithms, including: Stochastic Gradient Descent (SGD), Adaptive Boosting (AB), Linear Discriminant Analysis (LDA), Bagging (BAG), Gradient Boosting Trees (GBT), Logistic Regression (LR), Support Vector Classification (SVC), Nu-Support Vector Classification (NuSVC), K-Nearest Neighbors (KNN), Decision Tree (DT), Naive Bayes with Bernoulli distribution (NBB), Naive Bayes with Gaussian distribution (NBG), Multi-Layer Perceptron (MLP) and Random Forest (RF). The efficacy of these models was assessed through 10-fold cross-validation, employing receiver operating characteristic curve (ROC) analysis to compute performance metrics such as area under the curve (AUC), accuracy, sensitivity, and specificity. The model with good generalization ability across the three tasks and the highest area under the ROC curve (AUC), sensitivity, and specificity was selected. Decision curve analysis (DCA) was applied to determine the clinical utility of the radiomic model in classifying liver function, as illustrated in Fig. 3.

Workflow for constructing the radiomic models. Task 1, for distinguishing chronic liver disease: NLF vs. (CLD + CPA + Child–Pugh class B and C (CPBC)); Task 2, for distinguishing cirrhosis: (NLF + CLD) vs. (CPA + CPBC); Task 3, for distinguishing decompensated cirrhosis: (NLF + CLD + CPA) vs. CPBC. NLF, normal liver function; CLD, chronic liver disease without cirrhosis; CPA, Child–Pugh class A; CPBC, Child–Pugh class B + C; AUC, area under the curve; DCA, decision curve analysis
Statistical analysis
Statistical analyses were conducted using SPSS 16.0 (SPSS, IL, USA). The normality of the measurement data was assessed using the Kolmogorov‒Smirnov test. Quantitative data were reported as mean ± standard deviation for data following a normal distribution, and as median ± interquartile range for data that did not exhibit normal distribution. Differences between the training and test cohorts were evaluated using the Mann‒Whitney U test and Bonferroni correction as appropriate, with a threshold for statistical significance established at p < 0.05.
Results
Clinical characteristics
A total of 117 male patients with a median age of 51 ± 12.30 years and 46 female patients with a median age of 52.50 ± 12.07 years were included in the study. Among the participants, 44 had NLF, 32 had CLD, and 87 had cirrhosis. Among those with cirrhosis, 45 were classified as CPA, 28 as Child‒Pugh class B (CPB), and 14 as Child‒Pugh class C (CPC).
Radiomic feature selection and model analysis
For each dataset, 919 radiomic features were initially extracted. The segmentation was assessed using the intraclass correlation coefficient (ICC), and features sensitive to the segmentation method were excluded. The number of features extracted for the three stratified classification tasks from Native T1 maps, HBP T1 maps, and HBP images were as follows: 736, 740, and 763, respectively, all exhibiting high stability (ICC > 0.75).The mean and standard deviation of ICC values for Native T1 maps, HBP T1 maps, and HBP images were: 0.86 ± 0.05, 0.83 ± 0.06, and 0.83 ± 0.09, respectively. After removing highly correlated features using Spearman correlation analysis, 180, 184, and 177 features were retained for Task 1; 194, 194, and 193 for Task 2; and 197, 210, and 204 for Task 3. Among these, univariate analysis identified 121, 103, and 101 features as significantly different between the two groups in Task 1; 104, 90, and 110 in Task 2; and 116, 125, and 144 in Task 3. Finally, using the LASSO method, we selected 13, 10, and 9 valuable features for Task 1; 7, 10, and 11 for Task 2; and 11, 9, and 17 for Task 3, corresponding to the three sequences (see Supplementary Material 1). Based on these features, 12 radiomics models were developed.
Among the twelve models, the KNN model showed the best generalization across native T1 map, HBP T1 maps and HBP images across 3 tasks (Table 1). In the training set, the KNN model based on native T1 maps achieved high accuracy (0.83) in distinguishing chronic liver disease, 0.86 in distinguishing cirrhosis, and 0.86 in distinguishing decompensated cirrhosis, with corresponding AUCs of 0.92, 0.92, and 0.95, respectively. In the testing set, the accuracies were 0.75, 0.89, and 0.71, with AUCs of 0.79, 0.92, and 0.83, respectively (Table 1; Fig. 4). The DCA results indicated that the KNN model demonstrated the best generalized classification ability and overall strong performance across different liver function groups, providing varying degrees of net clinical benefit in distinguishing cirrhosis and decompensated cirrhosis. However, its effectiveness was comparatively lower in distinguishing chronic liver disease (Fig. 5).

ROC curves of the KNN model constructed from native T1 maps in the training and testing sets. ROC: receiver operating characteristic, KNN: K-Nearest Neighbors, T1: T1 relaxation time, CPA: Child–Pugh class A, CPBC: Child–Pugh class B + C

DCA plot of KNN model constructed from the native T1 maps in discriminating the stratified liver function groups. DCA: decision curve analysis, KNN: K-Nearest Neighbors, T1: T1 relaxation time, CPA: Child–Pugh class A, CPBC: Child–Pugh class B + C
For the model constructed using HBP images with T1 maps, the accuracies were 0.87, 0.94, and 0.94 in the training set, and 0.72, 0.90, and 0.72 in the testing set in distinguishing chronic liver disease, cirrhosis, and decompensated cirrhosis groups, respectively. The corresponding AUCs were 0.95, 0.98, and 0.98 in the training set, and 0.82, 0.93, and 0.79 in the testing set.
For the model constructed using HBP images without T1 maps, the accuracies were 0.85, 0.99, and 0.96 in the training set, and 0.81, 0.88, and 0.90 in the testing set in distinguishing chronic liver disease, cirrhosis, and decompensated cirrhosis groups, respectively. The corresponding AUCs were 0.94, 1.00, and 0.99 in the training set and 0.89, 0.94, and 0.95 in the testing set.
Discussion
To our knowledge, the present study is the first to use machine learning-based radiomic models for quantitatively evaluating liver reserve function with the T1 mapping technique in EOB-MRI. Radiomic analysis based on native T1 maps, HBP T1 maps and HBP images showed promising results in evaluating liver reserve function. The final KNN model that we selected showed favorable results in stratified analysis of distinguishing chronic liver disease, cirrhosis, and decompensated cirrhosis.
Notably, the radiomic models exhibited good discrimination performance when the radiomic features were extracted from the native T1 maps for stratifying different liver function groups (AUCs in the training set: 0.92–0.95, AUCs in the test set: 0.79–0.92). This suggests the possibility to evaluate liver function without contrast agents, thereby mitigating the risk of patient discomfort and allergic reactions, reducing financial burdens, and concurrently reducing examination times while enhancing patient comfort. In contrast, previous studies have suggested that T1pre measured from native T1 mapping has poor diagnostic performance in assessing liver function. Conflicting results have also been reported from several studies in identifying cirrhosis. Heye et al. [20] and Katsube et al. [14] reported prolonged pre-contrast T1 relaxation values in cirrhotic liver patients compared with control individuals, whereas the studies by Haimerl [21] et al. and Besa [7] et al. revealed no significant differences in the relaxation values between patients with normal and abnormal liver function. Moreover, several studies have reported paradoxical changes in that the T1 relaxation value from native T1 maps as liver function deteriorates [7]. Specifically, T1pre first increased from the normal liver function to the compensating cirrhosis group, and then decreased in the decompensated cirrhosis patients. This may partly explain the poor diagnostic performance of pre-contrast T1 relaxation value in liver function evaluation and why it performed better in distinguishing cirrhosis but failed in stratifying the chronic liver disease or the decompensated cirrhosis patients.
The radiomic models based on HBP images achieved better diagnostic efficacy in the assessment of liver function than native T1 maps, with the use of hepatocyte-specific contrast agent. In stratifying chronic liver disease, cirrhosis and decompensated cirrhosis, the HBP image-based radiomic models showed excellent efficacy (training set: AUCs 0.94, 1.00, and 0.99, respectively; test group: AUCs 0.89, 0.94, and 0.95, respectively). Previous studies investigated whether the SI from HBP images achieved good performance in evaluating liver function. Eiras-Araújo et al. [22] compared the relative enhancement index with the Child–Pugh score, the MELD score, and the ICG plasma disappearance rate, and the ROC curve revealed an AUC of 0.94 in discriminating patients with poor liver function. Ippolito et al. [23] used the SI from HBP images to successfully stratify patients with different Child‒Pugh classes and MELD scores. Takatsu et al. [24] investigated the quantitative liver–spleen contrast ratio with the albumin–bilirubin (ALBI) grading system, and a strong correlation was observed between the quantitative liver–spleen contrast ratio from HBP images obtained with Gd-EOB-DTPA and the ALBI grade. Other MRI parameters, including T1 relaxation-based indices (T1post, ΔT1) and two hepatocyte fraction indices (HeF and Khep), have also demonstrated promising results in assessing liver function [25, 26]. Notably, the highest AUC of 0.985 was achieved with Khep for differentiating cirrhosis [9, 10, 27], though this performance is still inferior to that of our method. Additionally, most previous studies did not include an NLF group or a CPC group. In contrast, our analyses encompassed all patient stratifications, from NLF to CLD, as well as various Child-Pugh classes. However, we did not analyze patients with CPC separately due to the small sample size, which would have hindered a comprehensive radiomic analysis.
In distinguishing cirrhosis, adding T1 mapping to the HBP images did not enhance the results of the models compared to using HBP images alone. Therefore, we cannot conclude that adding T1 mapping provides an additional benefit to HBP image-based radiomics for liver function analysis. Similar findings were reported by Makowski et al. [28], who used T1 mapping with biparametric MRI of prostate cancer through radiomics. They noted that while the addition of T1 mapping improved the accuracy of some classification models, it did not enhance the performance of the best model. However, when Chen et al. [25] added T1 mapping to HBP images in radiomic analysis for the preoperative prediction of microvascular invasion in hepatocellular carcinoma patients, the combination outperformed HBP images alone. Thus, it remains unclear whether T1 mapping should be added to HBP or other MR images for radiomic analysis. Given that the HBP image-based radiomic model developed here already demonstrates excellent results, the additional benefit of T1 mapping may be minimal. Nonetheless, confirming this assessment may require a larger study involving whole-liver ROI analysis or the application of a deep learning model.
Given the heterogeneity of liver function impairment in chronic liver disease, previous studies have investigated the effects of various ROI methods on results using quantitative techniques or radiomic analysis [28]. However, controversy persists regarding the optimal method for ROI delineation. For instance, studies by Vaziri-Bozorg et al. [29] found no difference in average apparent diffusion coefficient values between large and small ROIs. Similarly, Song J et al. [30] found no statistically significant differences in the efficacy of imaging-based models when comparing whole-liver and right-liver ROIs during evaluations of hepatic arterial infusion. Additionally, Yeung J et al. [31] suggested that choosing a 3D ROI for the whole liver might dilute texture features. As a result, we opted to select only four small ROIs distributed throughout the liver for our analysis. This approach yielded satisfactory results and offers a method that enhances clinical feasibility and practicality while simplifying image processing.
Limitation
First, while it involved a larger population compared to previous studies, the number of liver cirrhosis participants in the CPC group was relatively small, necessitating their analysis alongside patients with CPB. Second, we relied solely on the Child-Pugh score to categorize liver function, without evaluating other standards such as the ALBI score, MELD score, or ICG clearance test. Further research is needed to compare these categorization methods. Third, our use of small ROIs to represent whole-liver function may introduce bias, and further studies employing whole-liver ROIs are warranted. Additionally, this was a single-center study, and the performance of the existing radiomic model has not been externally validated. As such, the generalizability of the findings requires verification with multicenter, multivendor studies in larger cohorts before the radiomic analysis of quantitative native T1 imaging can be implemented in clinical practice.
Conclusions
In conclusion, our study demonstrates that radiomic analysis based on native T1 maps and HBP images, with or without T1 maps, shows promise in evaluating liver function, particularly in identifying cirrhosis. However, the additional benefits of the use of T1 maps on HBP images remain unclear and require further investigation.
Data availability
The datasets used and analysed during the current study are available from the corresponding author on reasonable request.
Abbreviations
- AB:
-
AdaBoost
- ALBI:
-
Albumin–bilirubin
- AUC:
-
Area under the curve
- CLD:
-
Chronic liver disease
- CPA:
-
Child-Pugh A
- CPB:
-
Child-Pugh B
- CPBC:
-
Child-Pugh B and C
- CPC:
-
Child-Pugh C
- DCA:
-
Decision curve analysis
- EOB-MRI:
-
Gadolinium-ethoxybenzyl-diethylenetriamine-enhanced magnetic resonance imaging
- FOV:
-
Field-of-view
- GBT:
-
Gradient boost tree
- Gd-EOB-DTPA:
-
Gadoxetic acid disodium or Gadolinium ethoxy-benzyl diethylenetriamine penta-acetic acid
- GLCM:
-
The gray-level co-occurrence matrix
- GLDM:
-
Gray-level dependence matrix
- GLRLM:
-
Gray-level run-length matrix
- GLSZM:
-
Gray-level size-zone matrix
- HBP:
-
Hepatobiliary phase
- ICC:
-
Intraclass correlation coefficient
- ICG:
-
Indocyanine green
- LASSO:
-
Least absolute shrinkage and selection operator
- MELD:
-
Model for End-Stage Liver Disease
- MLP:
-
Multilayer perceptron
- NGTDM:
-
Neighborhood gray-tone difference matrix
- NLF:
-
Normal liver function
- RF:
-
Random forest
- ROC:
-
Operating characteristic curve
- ROIs:
-
Regions of interest
- SI:
-
Signal intensity
- T1pre:
-
Pre-contrast T1 relaxation time
- TE:
-
Echo time
- TI:
-
Inversion time
- TR:
-
Repetition time
References
Ginès P, Krag A, Abraldes JG, et al. Liver cirrhosis. Lancet (London, England). 2021;398(10308):1359–76. https://doiorg.publicaciones.saludcastillayleon.es/10.1016/s0140-6736(21)01374-x.
Benson AB, D’Angelica MI, Abbott DE, et al. Hepatobiliary cancers, version 2.2021, NCCN clinical practice guidelines in oncology. J Natl Compr Canc Netw. 2021;19(5):541–65. https://doiorg.publicaciones.saludcastillayleon.es/10.6004/jnccn.2021.0022.
Van Beers BE, Pastor CM, Hussain HK. Primovist, Eovist: What to expect? J Hepatol. 2012;57(2):421–9. https://doiorg.publicaciones.saludcastillayleon.es/10.1016/j.jhep.2012.01.031.
Holzapfel K, Breitwieser C, Prinz C, et al. Contrast-enhanced magnetic resonance cholangiography using gadolinium-EOB-DTPA. Preliminary experience and clinical applications. Radiologe. 2007;47(6):536–44. https://doiorg.publicaciones.saludcastillayleon.es/10.1007/s00117-006-1444-x.
Zizka J, Klzo L, Ferda J, et al. Dynamic and delayed contrast enhancement in upper abdominal MRI studies: Comparison of gadoxetic acid and gadobutrol. Eur J Radiol. 2007;62(2):186–91. https://doiorg.publicaciones.saludcastillayleon.es/10.1016/j.ejrad.2007.02.035.
Bae KE, Kim SY, Lee SS, et al. Assessment of hepatic function with Gd-EOB-DTPA-enhanced hepatic MRI. Dig Dis. 2012;30(6):617–22. https://doiorg.publicaciones.saludcastillayleon.es/10.1159/000343092.
Besa C, Bane O, Jajamovich G, et al. 3D T1 relaxometry pre and post gadoxetic acid injection for the assessment of liver cirrhosis and liver function. Magn Reson Imaging. 2015;33(9):1075–82. https://doiorg.publicaciones.saludcastillayleon.es/10.1016/j.mri.2015.06.013.
Yoon JH, Lee JM, Kim E, et al. Quantitative liver function analysis: Volumetric T1 mapping with fast multisection B1 inhomogeneity correction in hepatocyte-specific contrast-enhanced liver MR imaging. Radiology. 2017;282(2):408–17. https://doiorg.publicaciones.saludcastillayleon.es/10.1148/radiol.2016152800.
Kim JE, Kim HO, Bae K, et al. T1 mapping for liver function evaluation in gadoxetic acid-enhanced MR imaging: Comparison of look-locker inversion recovery and B1 inhomogeneity-corrected variable flip angle method. Eur Radiol. 2019;29(7):3584–94. https://doiorg.publicaciones.saludcastillayleon.es/10.1007/s00330-018-5947-4.
Yoon JH, Lee JM, Kang HJ, et al. Quantitative assessment of liver function by using gadoxetic acid-enhanced MRI: Hepatocyte uptake ratio. Radiology. 2019;290(1):125–33. https://doiorg.publicaciones.saludcastillayleon.es/10.1148/radiol.2018180753.
Bi XJ, Zhang XQ, Zhang T, et al. Quantitative assessment of liver function with hepatocyte fraction: Comparison with T1 relaxation-based indices. Eur J Radiol. 2021;141:109779. https://doiorg.publicaciones.saludcastillayleon.es/10.1016/j.ejrad.2021.109779.
Ma B, Xu H, Wu X, et al. Evaluation of liver function using Gd-EOB-DTPA-enhanced MRI with T1 mapping. BMC Med Imaging. 2023;23(1):73. https://doiorg.publicaciones.saludcastillayleon.es/10.1186/s12880-023-01028-z.
Ai X, Wang H, Yang Y, et al. Four indices on Gd-EOB-DTPA-enhanced MRI can estimate liver functional reserve compared to ICG-R15: A systematic review and meta-analysis. Clin Imaging. 2023;102:1–8. https://doiorg.publicaciones.saludcastillayleon.es/10.1016/j.clinimag.2023.06.018.
Katsube T, Okada M, Kumano S, et al. Estimation of liver function using T1 mapping on Gd-EOB-DTPA-enhanced magnetic resonance imaging. Invest Radiol. 2011;46(4):277–83. https://doiorg.publicaciones.saludcastillayleon.es/10.1097/RLI.0b013e318200f67d.
Ding Y, Sun Z, You W, et al. Lymphoepithelioma-like intrahepatic cholangiocarcinoma with Epstein-Barr virus infection: Report of a rare case. Annals Translational Med. 2019;7(18):497. https://doiorg.publicaciones.saludcastillayleon.es/10.21037/atm.2019.08.105.
Lambin P, Leijenaar RTH, Deist TM, et al. Radiomics: The bridge between medical imaging and personalized medicine. Nat Rev Clin Oncol. 2017;14(12):749–62. https://doiorg.publicaciones.saludcastillayleon.es/10.1038/nrclinonc.2017.141. Epub 2017 Oct 4.
Thüring J, Rippel O, Haarburger C, et al. Multiphase CT-based prediction of Child-Pugh classification: A machine learning approach. Eur Radiol Experimental. 2020;4(1):20. https://doiorg.publicaciones.saludcastillayleon.es/10.1186/s41747-020-00148-3.
Zhang D, Cao Y, Sun Y, et al. Radiomics nomograms based on R2* mapping and clinical biomarkers for staging of liver fibrosis in patients with chronic hepatitis B: A single-center retrospective study. Eur Radiol. 2023;33(3):1653–67. https://doiorg.publicaciones.saludcastillayleon.es/10.1007/s00330-022-09137-z.
Koo TK, Li MY. A guideline of selecting and reporting intraclass correlation coefficients for reliability research. J Chiropr Med. 2016;15(2):155–63. https://doiorg.publicaciones.saludcastillayleon.es/10.1016/j.jcm.2016.02.012.
Heye T, Yang SR, Bock M, et al. MR relaxometry of the liver: Significant elevation of T1 relaxation time in patients with liver cirrhosis. Eur Radiol. 2012;22(6):1224–32. https://doiorg.publicaciones.saludcastillayleon.es/10.1007/s00330-012-2378-5.
Haimerl M, Verloh N, Zeman F, et al. Assessment of clinical signs of liver cirrhosis using T1 mapping on Gd-EOB-DTPA-enhanced 3T MRI. PLoS One. 2013;8(12):e85658. https://doiorg.publicaciones.saludcastillayleon.es/10.1371/journal.pone.0085658.
Eiras-Araujo AL, Parente DB, da Silva AC, et al. Relative enhancement index can be used to quantify liver function in cirrhotic patients that undergo gadoxetic acid-enhanced MRI. Eur Radiol. 2023;33(7):5142–9. https://doiorg.publicaciones.saludcastillayleon.es/10.1007/s00330-023-09402-9.
Ippolito D, Famularo S, Giani A, et al. Estimating liver function in a large cirrhotic cohort: Signal intensity of gadolinium-ethoxybenzyl-diethylenetriamine penta-acetic acid-enhanced MRI. Dig Liver Disease: Official J Italian Soc Gastroenterol Italian Association Study Liver. 2019;51(10):1438–45. https://doiorg.publicaciones.saludcastillayleon.es/10.1016/j.dld.2019.04.009.
Takatsu Y, Kobayashi S, Miyati T, et al. Hepatobiliary phase images using gadolinium-ethoxybenzyl-diethylenetriamine penta-acetic acid-enhanced MRI as an imaging surrogate for the albumin–bilirubin grading system. Eur J Radiol. 2016;85(12):2206–10. https://doiorg.publicaciones.saludcastillayleon.es/10.1016/j.ejrad.2016.10.010.
Chen M, Cao J, Hu J, et al. Clinical-Radiomic analysis for pretreatment prediction of objective response to first transarterial chemoembolization in hepatocellular carcinoma. Liver cancer. 2021;10(1):38–51. https://doiorg.publicaciones.saludcastillayleon.es/10.1159/000512028.
Bi X-J, Zhang X-Q, Zhang T, et al. Quantitative assessment of liver function with hepatocyte fraction: Comparison with T1 relaxation-based indices. Eur J Radiol. 2021;141. https://doiorg.publicaciones.saludcastillayleon.es/10.1016/j.ejrad.2021.109779
Liu MT, Zhang XQ, Lu J, et al. Evaluation of liver function using the hepatocyte enhancement fraction based on gadoxetic acid-enhanced MRI in patients with chronic hepatitis B. Abdom Radiol (NY). 2020;45(10):3129–35. https://doiorg.publicaciones.saludcastillayleon.es/10.1007/s00261-020-02478-7.
Makowski MR, Bressem KK, Franz L, et al. De Novo radiomics approach using image augmentation and features from T1 mapping to predict Gleason scores in prostate cancer. Invest Radiol. 2021;56(10):661–8. https://doiorg.publicaciones.saludcastillayleon.es/10.1097/RLI.0000000000000788.
Vaziri-Bozorg SM, Ghasemi-Esfe AR, Khalilzadeh O, et al. Diffusion-weighted magnetic resonance imaging for diagnosis of liver fibrosis and inflammation in chronic viral hepatitis: The performance of low or high B values and small or large regions of interest. Can Assoc Radiol J. 2012;63(4):304–11. https://doiorg.publicaciones.saludcastillayleon.es/10.1016/j.carj.2011.04.002
Song J, Yu X, Song W, et al. MRI-Based radiomics models developed with features of the whole liver and right liver lobe: Assessment of hepatic inflammatory activity in chronic hepatic disease. J Magn Reson Imaging: JMRI. 2020;52(6):1668–78. https://doiorg.publicaciones.saludcastillayleon.es/10.1002/jmri.27197.
Yeung J, Ganeshan B, Endozo R, et al. Equilibrium CT texture analysis for the evaluation of hepatic fibrosis: Preliminary evaluation against histopathology and extracellular volume fraction. J Personalized Med. 2020;10(2). https://doiorg.publicaciones.saludcastillayleon.es/10.3390/jpm10020046.
Acknowledgements
The authors would like to thank Dr. Qianrui Fan, Dr. Yudong Wang and Shizhen Gou (all from Institute of Research, InferVision, Ocean International Center, Chaoyang District, Beijing 100025, China) who provided technical support for the model construction of this study.
Funding
This study has received funding by Chongqing medical scientific research project (Joint project of Chongqing Health Commission and Science and Technology Bureau, Grant No. 2023QNXM029 & Grant No. 2022ZDXM026).
Author information
Authors and Affiliations
Contributions
Xin Li and Yangyang Liu conceptualized the ideas, designed the study, analyzed the data, constructed the models, and authored the manuscript text. Guangyong Ai, Xiaofeng Qiao, and Weijuan Chen were responsible for recruiting and scanning the patients. Qianrui Fan and Yudong Wang assisted in the statistical analysis and model building. Xiaojing He, Tianwu Chen, and Dajing Guo supervised the process of the study, offered assistance, reviewed the manuscript, and provided valuable suggestions. Additionally, Dajing Guo and Yangyang Liu provided fundings.
Corresponding author
Ethics declarations
Human ethics and consent to participate
The study was conducted in accordance with the Declaration of Helsinki (as revised in 2013). This study was approved by the Ethics Committee on Human Research of the Second Affiliated Hospital of Chongqing Medical University (approval number, (2021)121). Informed consent was waived, as the study was retrospective.
Consent to publish
NA.
Competing interests
The authors declare no competing interests.
Additional information
Publisher’s note
Springer Nature remains neutral with regard to jurisdictional claims in published maps and institutional affiliations.
Electronic supplementary material
Below is the link to the electronic supplementary material.
Rights and permissions
Open Access This article is licensed under a Creative Commons Attribution-NonCommercial-NoDerivatives 4.0 International License, which permits any non-commercial use, sharing, distribution and reproduction in any medium or format, as long as you give appropriate credit to the original author(s) and the source, provide a link to the Creative Commons licence, and indicate if you modified the licensed material. You do not have permission under this licence to share adapted material derived from this article or parts of it. The images or other third party material in this article are included in the article’s Creative Commons licence, unless indicated otherwise in a credit line to the material. If material is not included in the article’s Creative Commons licence and your intended use is not permitted by statutory regulation or exceeds the permitted use, you will need to obtain permission directly from the copyright holder. To view a copy of this licence, visit http://creativecommons.org/licenses/by-nc-nd/4.0/.
About this article

Cite this article
Li, X., Ai, G., Qiao, X. et al. Radiomic analysis using T1 mapping in gadoxetic acid disodium-enhanced MRI for liver function assessment. BMC Med Imaging 25, 111 (2025). https://doiorg.publicaciones.saludcastillayleon.es/10.1186/s12880-025-01658-5
Received:
Accepted:
Published:
DOI: https://doiorg.publicaciones.saludcastillayleon.es/10.1186/s12880-025-01658-5