- Research
- Open access
- Published:
Multimodal ultrasound radiomics model combined with clinical model for differentiating follicular thyroid adenoma from carcinoma
BMC Medical Imaging volume 25, Article number: 152 (2025)
Abstract
Objective
This study aimed to develop a nomogram integrating radiomics features derived from contrast-enhanced ultrasound (CEUS) and B-mode ultrasound (B-US) with clinical features to improve preoperative differentiation between follicular thyroid carcinoma (FTC) and follicular thyroid adenoma (FTA). Accurate preoperative diagnosis is critical for guiding appropriate treatment strategies and reducing unnecessary interventions.
Methods
We retrospectively included 201 patients with histopathologically confirmed FTC (n = 133) or FTA (n = 68). Radiomics features were extracted from B-US and CEUS images, followed by feature selection and machine-learning model development. Five models were evaluated, and the one with the highest area under the curve (AUC) was used to construct a radiomics signature. A Clinical Risk model was developed using statistically significant clinical features, which outperformed the conventional Chinese Thyroid Imaging Reporting and Data System (C-TIRADS) in both training and test groups. The radiomics signature and Clinical Risk model were integrated into a nomogram, whose diagnostic performance, calibration and clinical utility were assessed.
Results
The Clinical Risk model achieved superior diagnostic performance compared to the C-TIRADS model, with AUCs of 0.802 vs. 0.719 in the training group and 0.745 vs. 0.703 in the test group. The nomogram further improved diagnostic efficacy, with AUCs of 0.867 (95% CI, 0.800–0.933) in the training group and 0.833 (95% CI, 0.729–0.937) in the test group. It also demonstrated excellent calibration. Decision curve analysis (DCA) also indicated that the nomogram showed good clinical utility.
Conclusion
By combining CEUS and B-US radiomics features with clinical data, we developed a robust nomogram for distinguishing FTC from FTA. The model demonstrated superior diagnostic performance compared to existing methods and holds promise for enhancing clinical decision-making in thyroid nodule management.
Clinical trial number
Not applicable.
Introduction
Thyroid carcinoma is the greatest frequent endocrine tumor worldwide, and its prevalence has steadily increased [1–2]. Follicular thyroid carcinoma (FTC) is the second-most frequently differentiated cancer of the thyroid, following papillary thyroid cancer (PTC) [3]. The preoperative diagnosis of PTC is now well established. However, preoperative diagnosis of FTC remains difficult. Compared to PTC, FTC has a worse prognosis and a much-increased chance of distant metastases. Particularly, the incidence of lung and bone metastases in FTC is approximately double and ten-fold higher, respectively, than in PTC, which adversely affects human survival and health [4,5,6]. Data from the Memorial Sloan-Kettering Cancer Center showed that about half of patients with distant metastasis of differentiated thyroid cancer die of the disease within 5 years [7], so it is urgent to improve the rate of preoperative diagnosis of FTC.
Ultrasound is the preferred method for detecting thyroid nodules. Several ultrasound-based Thyroid Imaging Reporting and Data Systems (TIRADS) have been established around the world to correctly quantify the potential danger of malignant thyroid nodules. Among the most recognized are the ACR-TIRADS of the American College of Radiology, the EU-TIRADS of the European Society of Radiology, the K-TIRADS of the Korean Society of Radiology, and the C-TIRADS of the Chinese Society of Ultrasound Medicine. It is commonly accepted that characteristics like solidity, hypoechogenicity, non-parallel position, irregular margin, and microcalcification are indicative of thyroid cancer [8]. However, these risk stratification systems are mainly effective to PTC and demonstrate limited diagnostic accuracy for FTC [9–10]. Li et al. recently introduced the F-TI-RADS, demonstrating that ultrasonography characteristics including trabecular formation and composition are distinct risk indicators for FTC [11]. Currently, fine needle aspiration (FNA) cytology is now thought to be the most commonly employed technique for diagnosing thyroid tumors, however, due to the limited sampling of FNA, it is challenging to comprehensively assess the nodule’s capsule and vascular invasion [12]. Furthermore, it is challenging to differentiate FTC from follicular thyroid adenoma (FTA) based just on cytological characteristics because both conditions are derived from follicular thyroid cells [13,14,15]. It has been proposed that core-needle biopsy (CNB), which provides superior diagnosis accuracy for FTC, be used in addition to FNA [16]. However, CNB relies on the operator’s experience and is more invasive, which increases the risk of complications, including hematoma, hoarseness, dysphagia, etc., so it is still unable to be widely used in clinical practice [17–18]. At the moment, pathological examination following diagnostic surgery is the main method used to make a definitive diagnosis of FTC since it can verify the existence of capsular or vascular invasion. However, most suspected follicular thyroid neoplasms turn out to be benign, and diagnostic surgery can have substantial postoperative risks including hypothyroidism and recurrent laryngeal nerve damage [13, 19,20,21,22]. Thus, a noninvasive and trustworthy way to preoperatively differentiate between FTC and FTA is desperately needed.
Recently, radiomics has received widespread attention for its potential to diagnose tumors and monitor their treatment precisely. Radiomics offers significant insights into tumor phenotype and microenvironment by obtaining high-throughput microscopic characteristics derived from digital medical pictures. These insights can be integrated with clinical data to create decision-support models [23]. Previously, utilizing preoperative B-US pictures, Shin et al. created a classifier model based on artificial neural networks (ANN) and support vector machines (SVM), which distinguished between FTC and FTA with an accuracy of 74.1% and 69.0%, respectively [24]. Contrast-enhanced ultrasound (CEUS), which reflects microcirculatory perfusion within thyroid nodules, provides pathophysiological information not captured by conventional ultrasound [25–26]. Zhang et al. showed that B-US combined CEUS increased the diagnostic rate of thyroid nodules to 96.0% [27]. However, to date, no radiomics studies have been conducted using CEUS to differentiate FTC from FTA.
To further improve the precision of preoperative noninvasive identification of FTC and FTA and decrease unneeded operations for patients with benign lesions as well as misdiagnosis for patients with malignant tumors, we attempted to develop a combined decision support model in this study that incorporates radiomics features from both B-US and CEUS images along with clinical features.
Materials and methods
Patient enrollment
The retrospective research was approved by the ethical committee of the Third Xiangya Hospital, waiving the requirement for written informed consent. We retrospectively collected patients who underwent B-US and CEUS examinations in our hospital’s ultrasound department between January 2015 and September 2023. The following were the inclusion requirements: (1) patients who received surgery on the thyroid at our hospital and received postoperative pathologic confirmation of FTC and FTA; (2) patients who underwent B-US and CEUS examinations 2 weeks before the surgery with complete imaging data; (3) patients who had complete clinical information in the Electronic Medical Record System. Criteria for exclusion: (1) patients whose target nodule had received clinical treatment or invasive operation prior to ultrasound examination; (2) patients whose images were incomplete or poor quality; (3) patients whose nodule was too large to be fully visualized. Finally, 201 patients were to be recruited in the research; 133 of these patients had been diagnosed with FTC; and 68 with FTA. We split them into a training group and a test group by the random number method according to the ratio of 7:3. The flowchart for recruiting patients is shown in Fig. 1.
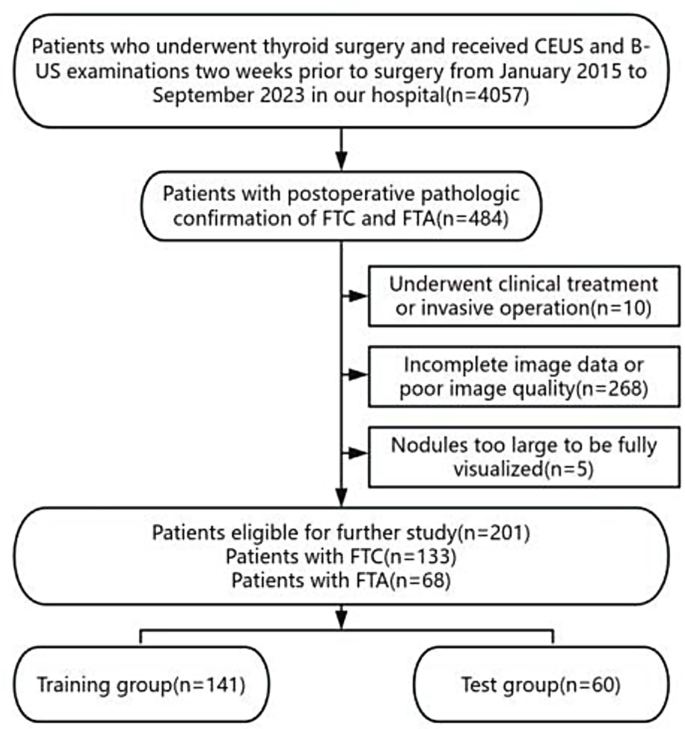
The flowchart for recruiting patients. FTC, Follicular thyroid carcinoma; FTA, Follicular thyroid adenoma; CEUS, Contrast-enhanced ultrasound; B-US, B-mode ultrasound
Our institution conducts the diagnosis and treatment of thyroid nodules in accordance with the “Guidelines for the Diagnosis and Treatment of Thyroid Nodules and Differentiated Thyroid Cancer”. The following outlines the criteria for selecting thyroid surgical intervention. (1) Thyroid nodules confirmed as malignant or suspicious for malignancy; (2) Surgical intervention is indicated for benign thyroid nodules presenting with any of the following operative indications: (a) Development of local compressive symptoms directly attributable to the nodule(s); (b) Concurrent hyperthyroidism refractory to medical management; (c) Retrosternal or mediastinal location of the mass; (d) Progressive nodule growth with clinical suspicion of malignant transformation or presence of high-risk factors for thyroid carcinoma; (e) Persistent patient request for surgery due to significant cosmetic concerns or psychological distress substantially impacting quality of life, which may be considered relative indications [28].
This study strictly adhered to the WHO Classification of Thyroid Tumors (5th edition) criteria for the diagnosis of FTC. Pathological examination was systematically performed on the tumor capsule and adjacent tissues from surgically resected intact tumor specimens using a serial sectioning technique, with particular emphasis on evaluating capsular integrity and vascular invasion. The definitive diagnosis was established based on the histopathological identification of either capsular invasion and/or tumor cell infiltration into vascular lumina, which served as conclusive diagnostic criteria. For borderline tumors with ambiguous morphological and clinical features between benign and malignant categories, in accordance with the 5th edition classification standards, these were classified as low-risk neoplasms with extremely low metastatic potential. Consequently, such nodules were excluded from this study. Histological exclusions comprised: Non-invasive follicular thyroid neoplasm with papillary-like nuclear features (NIFTP), thyroid tumors of uncertain malignant potential (UMP), and hyalinizing trabecular tumor (HTT) [29].
Image acquisition
To obtain B-US and CEUS images, Doppler color ultrasound systems-either the Siemens ACUSON Sequoia with a 10L4 probe or the GE LOGIQ E9 with a 9 L probe-were used. A professional radiologist with over a decade of experience in diagnosing thyroid conditions conducted all examinations. The ultrasound properties of the nodules were observed using dynamic B-US scanning, and each nodule’s maximum long-axis view was collected. Next, we changed to real-time CEUS mode, and observed the continually dynamical infusion procedure of the nodule in real-time after a rapid push of 2.4 mL the contrast agent (SonoVue (Brancouver, Milan, Italy)) into the elbow vein, then saved the dynamic image. Finally, B-US as well as CEUS pictures were output using DICOM format.
Acquisition of clinical information and evaluation of US images
Clinical data, including patient age and gender, were collected from the electronic medical record system. Nodule characteristics recorded from B-US included mean diameter, location (isthmus, left lobe, right lobe), taller than wide (absent or present), echogenicity (hypoechogenicity, isoechogenicity, hyperechogenicity), composition (solid, cystic and solid), margin (smooth, unclear or irregular), nodule-in-nodule (absent or present), trabecular formation (absent or present), halo (absent, uniform thin halo, uneven halo), tumor protrusion (absent or present), calcification (absent, microcalcification, macrocalcification). For CEUS, quantitative analysis was conducted using contrast analysis software (VueBox®), and features such as contrast agent arrival time (compared to surrounding thyroid parenchyma), peak intensity, presence of perfusion defects, and ring enhancement (absent, complete, incomplete) were recorded, and a single frame that matched the peak appearance of contrast infusion was intercepted for the region of interest (ROI) outlining.
Image segmentation and feature extraction
All of the images’ Pixels and grayscale were normalized, and ROIs were manually outlined on both B-US and CEUS images using 3D Slicer software 5.6.1 (open source software; https://www.slicer.org/). This process was initially carried out by a radiologist with more than two years of practice for thyroid diagnosis as well as was subsequently corrected by an experienced radiologist having over five years of practice. The Pyradiomics package in Python 3.10.9 has been utilized to extract radiomics characteristics, including shape features, intensity features, texture features (we utilized a range of techniques, including the neighborhood gray-tone difference matrix (NGTDM), gray level co-occurrence matrix (GLCM), gray level dependence matrix (GLDM), gray level run length matrix (GLRLM), and gray level size zone matrix (GLSZM), to comprehensively analyze the image texture), and wavelet-transformed features from the ROI of B-US and CEUS images of each patient. Ultimately, an overall of 831 radiomics characteristics were retrieved from both B-US as well as CEUS images for each patient.
Feature selection
In this research, we merged B-US as well as CEUS characteristics from radiomics for each patient, and then normalized radiomics features using Z-score normalization. Next, radiomics features with strong discriminatory power between FTC and FTA were screened by the following steps.
Correlation analysis: First, the correlation of characteristics was determined with Spearman’s rank correlation coefficient for highly repeated features. Only one feature was kept for every pair of characteristics in a correlation coefficient higher than 0.9. To preserve the maximum descriptive power of the features, a greedy recursive feature elimination strategy was employed. In this process, the feature exhibiting the highest redundancy within the current subset was iteratively removed.
Lasso Regression: Applying the least absolute shrinkage and selection operator (LASSO) regression model, further feature selection was carried out in the training group. LASSO screened out irrelevant features by shrinking the regression coefficient to zero through the regularization parameter λ. We employed 10-fold cross-validation to select the optimal λ by minimizing the average mean squared error (MSE) across all folds. Ultimately, the characteristics with non-zero coefficients of regression corresponding to the optimal λ value were retained.
Radiomics signature
The machine learning models of Logistic Regression (LR), Support Vector Machine (SVM), Random Forest (RF), K-Nearest Neighbor (KNN), and Light Gradient Boosting Machine (LightGBM) were fed the radiomics characteristics that had been filtered using Lasso regression. The models were taught in the training group, then their diagnostic ability was confirmed in the test group by displaying receiver operating characteristic (ROC) curves. Then we selected the model having the greatest area under the curve (AUC). The radiomics score from the top-performing model was chosen as the radiomics signature.
Clinic signature
The malignancy possibility for individual thyroid nodules was initially assessed using C-TIRADS and further refined by incorporating CEUS enhancement patterns. Based on previous studies, nodules displaying incomplete ring enhancement were upgraded by one level in the C-TIRADS classification, while those exhibiting complete ring enhancement were downgraded by one level [30–31]. Notably, nodules with an initial grade of 5 were not upgraded further. Using these adjusted C-TIRADS scores following CEUS evaluation, a conventional C-TIRADS model was developed via logistic regression in the training group, then the diagnostic effectiveness was validated in the test group.
Based on the statistical variations in clinic baseline compared FTC with FTA patients in the training group, the clinical characteristics with a p-value of less than 0.05 were selected as clinical risk indicators for predicting the risk of FTC, which were also inputted into the LR model. The Clinic Risk LR model was built in the training group, and effectiveness for diagnosis was confirmed in the test group.
The two clinical models’ ROC curves were plotted in both test as well as training groups, and the AUC of the two models was contrasted, and the one with a high AUC value was selected, and then the clinical risk score of each patient derived from this model was subsequently designated clinic signature.
Nomogram
In this research, we combined the radiomics signature and clinic signature into a nomogram using logistic regression. We then displayed ROC curves and assessed the AUC, accuracy(ACC), sensitivity, specificity, negative predictive value (NPV), and positive predictive value (PPV) for each model in both the training and test groups. We compared the difference in AUC values of the nomogram with those of the radiomics signature as well as the clinic signature alone by using the Delong test in the training and test groups. Calibration curves were constructed to assess the nomogram’s calibration effectiveness, and the Hosmer-Lemeshow test was utilized to determine the degree of fitting. Furthermore, decision curve analysis (DCA) was employed to evaluate the clinical utility of the model. Figure 2 shows the overall workflow diagram.

Overall Workflow Diagram. LASSO, least absolute shrinkage and selection operator; ROC curve, receiver operating characteristic curve
Statistical analysis
The statistical analyses and visualization were conducted using Python 3.10.9, SPSS 26 and R 4.1.1. The quantitative information was displayed as median ± range interquartile or mean ± standard deviation. In accordance with the normally distributed nature of the data, we used relevant statistical procedures, such as the t-test, Mann-Whitney U-test, Chi-square test, or Fisher’s exact test to assess the differences in clinical variables between the training and test groups. The Delong test investigated differences in the diagnostic efficacy of models, and the Hosmer-Lemeshow test was used to assess the goodness-of-fit of the nomogram. Statistical significance was set at p < 0.05 for all analyses.
Results
Baseline clinical characteristics of patients
The clinical baseline characteristics of 201 participants within the training and test groups are shown in Table 1, respectively. This research had 201 participants (133 FTC and 68 FTA), with a mean age of 46.28 ± 13.33 years. Patients were separated into a training group (n = 141) and a test group (n = 60) using a 7:3 random number approach. There were no statistically significant variations in age or gender dispersion among FTC and FTA patients (p > 0.05). There was no statistically significant distinction in the test group (p > 0.05), but there was a statistically significant distinction in the training group’s C-TIRADS score distribution between the two patient groups (p < 0.05). Meanwhile, comparisons were made between patients with FTC and FTA regarding various ultrasound (US) features (including mean diameter, location, taller than wide, echogenicity, composition, margin, nodule-in-nodule, trabecular formation, halo, tumor protrusion, calcification, arrival time, peak intensity, perfusion defect, and ring enhancement). In the training group, the nodule’s echogenicity, composition, calcification, presence or absence of trabecular formation, contrast agent arrival time, presence or absence of perfusion defect, and ring enhancement were significantly different between FTA and FTC (p < 0.05), and the rest of the US features distribution were not statistically different.
Rad signature
We extracted an overall of 1662 radiomics characteristics from the B-US and CEUS images of the thyroid gland of each patient. Through Spearman correlation analysis, the Spearman correlation coefficient threshold was set to 0.9 in order to exclude highly correlated features, and 446 features were screened. And then through lasso regression combined with 10-fold cross-validation, the model’s error was minimized, when the regularization parameter λ was 0.0791 (Fig. 3a and b). At this point, seven radiomics features were remained, three derived from B-US images and four from CEUS images, including two shape features, three wavelet-transformed texture features, and two wavelet-transformed intensity features (Fig. 3c). The screened radiomics features were input into LR, SVM, RF, KNN, and LightGBM machine learning models, with subsequent calculation of the AUC values for each model (Fig. 4a and b). The results showed that in the test group, the LR model obtained the largest AUC value (0.787 vs. 0.749 vs. 0.724 vs. 0.663 vs. 0.724). Next, we weighted each variable based on the regression coefficients in the LR model and computed the rad score of each patient as the rad signature.

The radiomics Features were screened by using Lasso Regression Combined with 10-fold Cross-Validation. (a) Coefficient convergence figure (b) Cross-validation error figure (c) Weights of radiomics features

The predictive performance of identifying between FTC and FTA in different radiomics models was assessed by the receiver operating characteristic (ROC) curve and area under the curve (AUC). (a) The training group (b) The test group
Clinic signature
Based on the results of the differential distribution of each clinic and US feature in the training group in the FTC and FTA, the features including echogenicity, composition, calcification, trabecular formation, arrival time, perfusion defect, and ring enhancement were selected as meaningful variables (p < 0.05) to construct the Clinic Risk LR model. This model has higher diagnostic AUC values than the C-TIRADS model for the training and test groups (0.802 vs. 0.719 and 0.745 vs. 0.703, respectively), as shown in Table 2. Figure 5 illustrates the ROCs for two models. So we weighted each variable according to the regression coefficients in the Clinic Risk LR model and computed an individualized FTC risk assessment for each patient, which served as the clinic signature.

The receiver operating characteristic curves (ROCs) of the Clinic Risk Logistic Regression Model and C-TIRADS Model. (a) The training group (b) The test group
Nomogram
The Rad signature and the clinic signature in the training group were combined in this work using logistic regression to create a nomogram, as illustrated in Fig. 6. In the training group, the nomogram had an AUC that was significantly greater than the rad signature (0.867 vs. 0.788, p < 0.01) and clinic signature (0.867 vs. 0.802, p < 0.05). In the test group, the nomogram had an AUC that was greater than the rad signature (0.833 VS 0.787) and clinic signature (0.833 VS 0.745), and was significantly distinct from the clinic signature (p < 0.05), as shown in Table 3. Figure 7 illustrates the ROC for each model. The calibration curves of the nomogram, rad signature, and clinic signature demonstrated moderate alignment between predicted and actual values, as shown in Fig. 8, and the Hosmer-Lemeshow test revealed no statistically significant variance across predicted and actual values in the training and test groups (p > 0.05). This study evaluated the clinical utility of three prediction models through DCA (Fig. 9). The results demonstrated that the net benefits of all three models in both the training and test groups exceeded those of the “all-intervention” and “no-intervention” strategies across the majority of threshold probability intervals. Within the training group, the nomogram exhibited superior net benefits compared to both the single clinic risk model and radiomics model in most threshold probability intervals. In the test group, the nomogram demonstrated higher net benefits than either the single radiomics model or clinical risk model when the threshold probability ranged from 24 to 58%.

The Nomogram was constructed by combining Rad signature and clinic signature. The risk represented the predictive probability of follicular thyroid carcinoma

The receiver operating characteristic curves (ROCs) of the Clinic signature, Rad signature, and Nomogram. (a) The training group (b) The test group

Calibration curves for the Clinic signature, Rad signature, and Nomogram. (a) The training group (b) The test group

Decision curves analysis for the Clinic signature, Rad signature, and Nomogram. (a) The training group (b) The test group
Discussion
Currently, identifying FTC and FTA is difficult by preoperative ultrasound and FNA examinations, and CNB depends on operator expertise and carries an increased risk of complications, whereas diagnostic surgery causes unnecessary surgical burden and financial costs on patients. Therefore, we developed a nomogram incorporating radiomics features from both B-US and CEUS, combined with clinical features, which obtained good AUCs of 0.867 and 0.833 in both the test and training groups, correspondingly. In addition, we developed a Clinic Risk LR model based on B-US and CEUS images, which outperformed the C-TIRADS model in diagnostic efficacy.
Ultrasound images contain substantial pathophysiological information that is not easily discernible to the naked eye but can be revealed through the extraction of radiomics features using machine learning, allowing for greater clinical utility [32]. Previous research has already explored radiomics models based on preoperative B-US images of thyroid follicular tumors. Yu et al. generated a logistic regression model utilizing preoperative B-US pictures with an AUC of 0.771 [33]. Similarly, Shin et al. constructed a classifier model using artificial neural networks (ANN) and support vector machines (SVM), with reported AUCs of 0.612 and 0.605, respectively24. Furthermore, studies have demonstrated that the machine-learning radiomics models of CEUS images are also useful in diagnosing benign and malignant thyroid nodules [34–35]. However, as far as we know, no research has applied CEUS to radiomics for the identification of FTC and FTA. In this research, we merged B-US and CEUS radiomics features to create several machine-learning models, with the LR model outperforming the others in the test group (AUC: 0.787, ACC: 0.767). Logistic regression is particularly effective for smaller datasets, as it provides higher stability and reduces the risk of overfitting, particularly given our study’s limited sample of 201 patients. In contrast, non-parametric models such as KNN are more sensitive to sample size and susceptible to noise, while complex models such as RF or LightGBM may tend to overfit the training data and thus perform poorly on the test group.
In our research, we analyzed the clinical characteristics of patients experiencing FTC as well as FTA, statistically significant variations were observed in features such as echogenicity, composition, and internal calcification, while no significant differences in margin, and taller than wide. Unlike PTC, FTC presented with more frequent macrocalcification, consequently, 51.13% of the FTC patients in our study were categorized into the 3-4a categories based on the C-TIRADS system, highlighting its limited diagnostic efficacy for FTC in clinical practice (test group, AUC: 0.703). It is noteworthy that the macrocalcification feature observed in FTC may potentially reflect its intrinsic metabolic disorder status; however, the specific pathophysiological mechanisms underlying this association still require further validation through large-scale multicenter studies with substantial sample sizes. Therefore, Building upon previous studies, we additionally included US features including the mean diameter, nodule-in-nodule, trabecular formation, tumor protrusion, arrival time, peak intensity, perfusion defect, and ring enhancement, among them, trabecular formation, arrival time, perfusion defect, and ring enhancement also showed statistical differences between FTC and FTA. Consistent with the findings reported by Li et al.11, the present investigation identified high-risk ultrasound features with comparable diagnostic significance, specifically solid composition and trabecular formation. These ultrasound characteristics demonstrate substantial clinical utility in the differential diagnosis between FTC and FTA. The feature of “trabecular formation” is defined as a spoke-like central scar or network-like extension within the nodule [36]. FTC exhibits rapid proliferative characteristics and may present as microfollicular structures lacking distinct follicular lumens. The densely packed follicular cells can lead to trabecular architectures, which likely constitute the histological basis for this distinct morphological pattern. And the original shape Elongation that we extracted from the B-US and CEUS images also suggests that FTC may exhibit a higher degree of ductility, as they tend to invade along tissue spaces or blood vessels and form irregular and ductile shapes. Multiple studies have demonstrated that FTC tends to exhibit solid composition, a conclusion that has been further corroborated by our investigation. We hypothesize that this morphological characteristic may be associated with specific biological properties of tumor cells, including heightened invasive capacity and an accelerated proliferation rate. In our study, 91.67% of FTC cases in the training group exhibited hypoechogenicity. Current literature suggests that this sonographic phenomenon may correlate with ultrasound reflection attenuation caused by abnormal hyperplasia and compact arrangement of follicular epithelial cells [37]. In contrast, FTA typically exhibits isoechogenicity, a characteristic which suggests closer resemblance to the physiological properties of adjacent normal thyroid tissue. FTC exhibits incomplete ring enhancement in CEUS, which may be due to localized capsular invasion of FTC, resulting in disruption of capsular integrity, which is consistent with the pathological manifestation of FTC. Our study showed that hypoechoicity, solid, macrocalcification, presence of trabecular formation, presence of perfusion defect, and incomplete ring enhancement are risk indicators for the diagnosis of FTC. In contrast, FTA showed synchronous enhancement with surrounding thyroid tissue as well as complete ring enhancement. The diagnostic efficacy of our Clinic Risk LR model based on the screened meaningful variables was higher than the C-TIRADS model in both the training and test groups.
However, this research does have certain drawbacks. First, there is selection bias in this limited sample size, single-center investigation. Multicenter, large-sample investigations will be used in future research to increase the model’s generalizability. Second, the quality of the clinical data is limited by the study’s retrospective design and reliance on static images. Prospective clinical trials will be conducted to validate our findings. Third, the main obstacle in translating radiomics into precision medicine clinical practice is the lack of interpretability, so future studies need more advanced deep learning techniques to visualize predictive models. Fourth, as a regional comprehensive medical center in China, our hospital receives more cases of thyroid malignancies. Furthermore, this study includes CEUS, an advanced diagnostic modality for thyroid disorders, as one of the core inclusion criteria. These dual factors have collectively resulted in an imbalanced case composition ratio between malignant and benign tumors within our study cohort, potentially introducing selection bias. To enhance the clinical applicability of research findings, we propose to implement multi-center collaborative investigations that incorporate data from primary healthcare institutions. Additionally, we intend to expand the sample scope by including patients who did not undergo CEUS examination, thereby optimizing the representativeness of the study population.
In conclusion, we combined the clinic signature and radiomics signature to construct a nomogram by logistic regression. The nomogram’s AUC was further improved (test group, AUC: 0.833), and was significantly greater than the clinic signature (p < 0.05). In addition, the nomogram also demonstrated good calibration performance and an excellent degree of fitting between predicted and actual values. These findings suggest that a risk prediction model integrating radiomics features with clinically meaningful variables holds promise for clinical application, offering new perspectives for the diagnosis and management of FTC.
Conclusion
We built a Clinic Risk LR model based on B-US and CEUS images that outperform the conventional C-TIRADS model for identifying FTA and FTC. The combined decision support model built by combining the radiomics features derived from the images of the two could further improve the accuracy of preoperative noninvasive identification of FTC and FTA, in order to decrease needless surgeries for patients with benign lesions and misdiagnosis in patients with malignant lesions.
Data availability
Data may be made available on reasonable request to the authors.
Abbreviations
- FTC:
-
Follicular thyroid carcinoma
- FTA:
-
Follicular thyroid adenoma
- PTC:
-
Papillary thyroid cancer
- TIRADS:
-
Thyroid Imaging Reporting and Data System
- FNA fine:
-
Needle aspiration
- CEUS:
-
Contrast-enhanced ultrasound
References
Lyu Z, Zhang Y, Sheng C, Huang Y, Zhang Q, Chen K. Global burden of thyroid cancer in 2022: incidence and mortality estimates from GLOBOCAN. Chin Med J. 2024;137(21):2567–76.
Pizzato M, Li M, Vignat J, Laversanne M, Singh D, La Vecchia C, et al. The epidemiological landscape of thyroid cancer worldwide: GLOBOCAN estimates for incidence and mortality rates in 2020. Lancet Diabetes Endocrinol. 2022;10(4):264–72.
Wiltshire JJ, Drake TM, Uttley L, Balasubramanian SP. Systematic review of trends in the incidence rates of thyroid Cancer. Thyroid. 2016;26(11):1541–52.
Sugino K, Ito K, Mitsuji Nagahama, Kitagawa W, Shibuya H, Ohkuwa K, et al. Prognosis and prognostic factors for distant metastases and tumor mortality in follicular thyroid carcinoma. Thyroid. 2011;21(7):751–7.
Pacini F, Castagna MG, Brilli L, Pentheroudakis G. Thyroid cancer: ESMO clinical practice guidelines for diagnosis, treatment and follow-up. Ann Oncol. 2012;23(supplement 7):vii110–9.
Durante C, Haddy N, Baudin E, Leboulleux S, Hartl D, Travagli JP, et al. Long-Term outcome of 444 patients with distant metastases from papillary and follicular thyroid carcinoma: benefits and limits of radioiodine therapy. J Clin Endocrinol Metabolism. 2006;91(8):2892–9.
Nixon IJ, Whitcher MM, Palmer FL, Tuttle RM, Shaha AR, Shah JP, et al. The impact of distant metastases at presentation on prognosis in patients with differentiated carcinoma of the thyroid gland. Thyroid. 2012;22(9):884–9.
Alexander EK, Cibas ES. Diagnosis of thyroid nodules. Lancet Diabetes Endocrinol. 2022;10(7):533–9.
Lin Y, Lai S, Wang P, Li J, Chen Z, Wang L, et al. Performance of current ultrasound-based malignancy risk stratification systems for thyroid nodules in patients with follicular neoplasms. Eur Radiol. 2022;32(6):3617–30.
Park JW, Kim DW, Kim D, Baek JW, Lee YJ, Baek HJ. Korean thyroid imaging reporting and data system features of follicular thyroid adenoma and carcinoma: a single-center study. Ultrasonography. 2017;36(4):349–54.
Li J, Li C, Zhou X, Huang J, Yang P, Cang Y, et al. US risk stratification system for follicular thyroid neoplasms. Radiology. 2023;309(2):e230949.
Ahn HS, Kim HS, Hong MJ. Ultrasonographic and cytologic assessments of follicular neoplasms of the thyroid: Predictive features differentiating follicular carcinoma from follicular adenoma. Soares P, editor. PLOS ONE. 2022;17(7):e0271437.
Haugen BR, Alexander EK, Bible KC, Doherty GM, Mandel SJ, Nikiforov YE, et al. 2015 American thyroid association management guidelines for adult patients with thyroid nodules and differentiated thyroid cancer: the American thyroid association guidelines task force on thyroid nodules and differentiated thyroid Cancer. Thyroid: Official J Am Thyroid Association. 2016;26(1):1–133.
Hirokawa M, Suzuki A, Kawakami M, Kudo T, Miyauchi A. Criteria for follow-up of thyroid nodules diagnosed as follicular neoplasm without molecular testing– The experience of a high‐volume thyroid centre in Japan. Diagn Cytopathol. 2022;50(5):223–9.
Siarhei U, Yakubouski, Henadz H, Kandratsenka, Fridman M, Viktor A, Kondratovich, Olga A. Perkhova. Diagnostic performance of thyroid FNA: experience of Belarusian National referral thyroid Cancer center. Diagn Cytopathol. 2024;52(12):763–73.
Yoon RG, Baek JH, Lee JH, Choi YJ, Hong MJ, Song DE, et al. Diagnosis of thyroid follicular neoplasm: Fine-Needle aspiration versus Core-Needle biopsy. Thyroid. 2014;24(11):1612–7.
Na DG, Baek JH, Jung SL, Kim J, Sung JY, Kim KS, et al. Core needle biopsy of the thyroid: 2016 consensus statement and recommendations from Korean society of thyroid radiology. Korean J Radiol. 2017;18(1):217.
Sung JY, Na DG, Kim KS, Yoo H, Lee H, Kim JH, et al. Diagnostic accuracy of fine-needle aspiration versus core-needle biopsy for the diagnosis of thyroid malignancy in a clinical cohort. Eur Radiol. 2012;22(7):1564–72.
McHenry CR, Phitayakorn R. Follicular adenoma and carcinoma of the thyroid gland. Oncologist. 2011;16(5):585–93.
Staubitz JI, Musholt PB, Musholt TJ. The surgical dilemma of primary surgery for follicular thyroid neoplasms. Baillière’s Best Pract Res Clin Endocrinol Metabolism. 2019;33(4):101292–2.
Randolph GW, Shin JH, Grillo HC, Mathisen D, Katlic MR, Kamani D, et al. The surgical management of goiter: part II. Surgical treatment and results. Laryngoscope. 2011;121(1):68–76.
Neven Mateša, Tabain I, Dabelić N, Petric V, Zvonko Kusić. Diagnostic relevance of fine needle aspiration cytology for follicular lesions of the thyroid: retrospective study. PubMed. 2002;43(5):606–9.
Gillies RJ, Kinahan PE, Hricak H. Radiomics: images are more than pictures, they are data. Radiology. 2016;278(2):563–77.
Shin I, Kim YJ, Han K, Lee E, Kim HJ, Shin JH, et al. Application of machine learning to ultrasound images to differentiate follicular neoplasms of the thyroid gland. Ultrasonography. 2020;39(3):257–65.
Yu D, Han Y, Chen T. Contrast-Enhanced ultrasound for differentiation of benign and malignant thyroid lesions. Otolaryngology–Head Neck Surg. 2014;151(6):909–15.
Trimboli P, Castellana M, Virili C, Havre RF, Bini F, Marinozzi F, et al. Performance of contrast-enhanced ultrasound (CEUS) in assessing thyroid nodules: a systematic review and meta-analysis using histological standard of reference. Radiol Med. 2020;125(4):406–15.
Zhang Y, Zhou P, Tian SM, Zhao YF, Li JL, Li L. Usefulness of combined use of contrast-enhanced ultrasound and TI-RADS classification for the differentiation of benign from malignant lesions of thyroid nodules. Eur Radiol. 2016;27(4):1527–36.
Chinese Society of Endocrinology, Chinese Society of Surgery, Chinese Anti-Cancer Association Head and Neck Tumor Professional Committee, Chinese Medical Association Nuclear Medicine Branch. Guidelines for the diagnosis and management of thyroid nodules and differentiated thyroid cancer. Chin J Clin Oncol. 2012;39(17):1249–72.
Baloch ZW, Asa SL, Barletta JA, Ghossein RA, Juhlin CC, Jung CK, et al. Overview of the 2022 WHO classification of thyroid neoplasms. Endocr Pathol. 2022;33(1):27–63.
Wu Q, Qu Y, Li Y, Liu Y, Shen J, Wang Y. Logistic regression analysis of contrast-enhanced ultrasound and conventional ultrasound of follicular thyroid carcinoma and follicular adenoma. Gland Surg. 2021;10(10):2890–900.
Zhang B, Jiang Y, Liu J, Yang M, Dai Q, Zhu Q, et al. Utility of Contrast-Enhanced ultrasound for evaluation of thyroid nodules. Thyroid: Official J Am Thyroid Association. 2010;20(1):51–7.
Lambin P, Leijenaar RTH, Deist TM, Peerlings J, de Jong EEC, van Timmeren J, et al. Radiomics: the Bridge between medical imaging and personalized medicine. Nat Reviews Clin Oncol. 2017;14(12):749–62.
Yu B, Li Y, Yu X, Ai Y, Jin J, Zhang J, et al. Differentiate thyroid follicular adenoma from carcinoma with combined ultrasound radiomics features and clinical ultrasound features. J Digit Imaging. 2022;35(5):1362–72.
Guo S, Zhou P, Zhang Y, Jiang LQ, Zhao Y. Exploring the value of radiomics features based on B-Mode and Contrast-Enhanced ultrasound in discriminating the nature of thyroid nodules. Front Oncol. 2021;11:738909.
Ren JY, Wen-Zhi Lv, Wang L, Zhang W, Ma YY, Huang YZ, et al. Dual-modal radiomics nomogram based on contrast-enhanced ultrasound to improve differential diagnostic accuracy and reduce unnecessary biopsy rate in ACR TI-RADS 4–5 thyroid nodules. Cancer Imaging. 2024;24(1):17.
Kuo TC, Wu MH, Chen KY, Hsieh MS, Chen A, Chen CN. Ultrasonographic features for differentiating follicular thyroid carcinoma and follicular adenoma. Asian J Surg. 2020;43(1):339–46.
Sillery JC, Reading CC, Charboneau JW, Henrichsen TL, Hay ID, Mandrekar JN. Thyroid follicular carcinoma: sonographic features of 50 cases. Am J Roentgenol. 2010;194(1):44–54.
Acknowledgements
This study was supported by the Major Scientific Research Program for High-level Talents in Healthcare in Hunan Province [R2023078].
Funding
This work was supported by the Major Scientific Research Program for High-level Talents in Healthcare in Hunan Province [R2023078].
Author information
Authors and Affiliations
Contributions
Conceiving the study and design: Q.Q. Zhao, S.Y. Guo and Y. Zhang. Collection and curation of the clinical datasets: Q.Q. Zhao. Methodology, data analysis and interpretation: S.Y. Guo. Assistance with data collection: J.G. Zhou. Drafting of the manuscript: Q.Q. Zhao and S.Y. Guo. Provided critical feedback on the conceptualization, validated the project, and participated in the review and editing of the manuscript: P. Zhou. Critical analysis and manuscript revision: all authors. The authors read and approved the final manuscript.
Corresponding author
Ethics declarations
Ethics approval and consent to participate
This study was approved by the Ethics Committee of the Third Xiangya Hospital (approval no.24576, approval date: 5 July 2024). We certify that the study was performed in accordance with the Helsinki Declaration of 1975 and later amendments. Informed consent was waived for all patients due to the retrospective nature of this study.
Consent for publication
Not applicable.
Competing interests
The authors declare no competing interests.
Additional information
Publisher’s note
Springer Nature remains neutral with regard to jurisdictional claims in published maps and institutional affiliations.
Rights and permissions
Open Access This article is licensed under a Creative Commons Attribution-NonCommercial-NoDerivatives 4.0 International License, which permits any non-commercial use, sharing, distribution and reproduction in any medium or format, as long as you give appropriate credit to the original author(s) and the source, provide a link to the Creative Commons licence, and indicate if you modified the licensed material. You do not have permission under this licence to share adapted material derived from this article or parts of it. The images or other third party material in this article are included in the article’s Creative Commons licence, unless indicated otherwise in a credit line to the material. If material is not included in the article’s Creative Commons licence and your intended use is not permitted by statutory regulation or exceeds the permitted use, you will need to obtain permission directly from the copyright holder. To view a copy of this licence, visit http://creativecommons.org/licenses/by-nc-nd/4.0/.
About this article

Cite this article
Zhao, Q., Guo, S., Zhang, Y. et al. Multimodal ultrasound radiomics model combined with clinical model for differentiating follicular thyroid adenoma from carcinoma. BMC Med Imaging 25, 152 (2025). https://doiorg.publicaciones.saludcastillayleon.es/10.1186/s12880-025-01685-2
Received:
Accepted:
Published:
DOI: https://doiorg.publicaciones.saludcastillayleon.es/10.1186/s12880-025-01685-2