- Research
- Open access
- Published:
Differentiation of multiple adrenal adenoma subtypes based on a radiomics and clinico-radiological model: a dual-center study
BMC Medical Imaging volume 25, Article number: 45 (2025)
Abstract
Background
The prevalence and detection rates of adrenal incidentalomas have been on the rise globally, with more than 90% of these lesions pathologically classified as adrenocortical adenomas. Among these, approximately 30% of patients present with hormone-secreting adenomas, leading to the deterioration of their health, with some requiring surgical resection. The available methods for adrenal function evaluation are invasive and costly. Moreover, their accuracy is influenced by numerous factors. Therefore, it is imperative to develop non-invasive and simplified preoperative diagnostic approach.
Methods
A retrospective study was performed on 169 patients from two tertiary medical centers. Subsequently, radiomics features were extracted after tumor margins were delineated layer-by-layer using a semi-automatic contouring approach. Feature selection was achieved in two cycles, with the first round utilizing a support vector machine (SVM) and the second round using a LASSO-based recursive feature elimination algorithm. Finally, logistic regression models were constructed using the clinico-radiological, radiomics, and a combination of both.
Results
After a comprehensive evaluation of the predictive indicators, the logistic regression classifier model based on the combined clinico-radiological and radiomic features had an AUC of (0.945, 0.927, 0.856) for aldosterone-producing adenoma (APA), (0.963, 0.889, 0.887) for cortisol-producing adenoma (CPA), and (0.940, 0.765, 0.816) for non-functioning adrenal adenoma (NAA) in the training set, validation set, and external test set, respectively. This model exhibited superior predictive performance in differentiating between the three adrenal adenoma subtypes.
Conclusions
A logistic regression model was constructed using radiomics and clinico-radiological features derived from multi-phase enhanced CT images and conducted external validation. The combined model showed good overall performance, highlighting the feasibility of applying the model for preoperative differentiation and prediction of various types of ACA.
Introduction
Adrenal incidentaloma (AI) refers to adrenal nodules discovered during imaging examinations conducted for health check-ups or non-adrenal diseases, with a maximum diameter ≥ 1 cm. Therefore, AI is an imaging-based definition, presenting with pathological changes, including tumors, nodular hyperplasia, cysts, or inflammatory nodules, among others. As the utility of medical imaging examinations increases and people’s awareness about the need for health check-ups increases, the incidence and detection rate of AI have been increasing globally [1,2,3,4]. In most cases, AI originates in the adrenal cortex, with over 90% pathologically classified as adrenocortical adenomas (ACA), among which nearly 30% exhibit clinical symptoms [5, 6]. These include aldosterone-producing adenomas (APA), which are associated with hypertension and hypokalemia, and cortisol-producing adenomas (CPA), manifesting as hypertension, moon face, buffalo hump, and central obesity, collectively referred to as functioning AI with potentially serious detrimental effects on the patients. Non-functioning adrenal adenomas (NAA) without clinical symptoms can be managed through observation, whereas adrenal adenomas with hormone secretion functions require surgical intervention [7].
It has been found that the assessment of adrenal adenoma functionality solely based on radiological examinations may not accurately distinguish all types of conditions [8,9,10]. Although various auxiliary diagnostic methods such as the aldosterone/renin ratio (ARR), captopril test, seated saline infusion test, oral sodium loading test, 1 mg dexamethasone suppression test, and adrenal vein sampling have been developed to differentiate functional from non-functional adrenal adenoma [11], their performance is limited by several factors including, reference values, healthcare center conditions, test errors, patient physiological conditions or economic factors, and result turnaround time.
Computed tomography (CT) is routinely applied in preoperative examination of patients with adrenal masses is currently the preferred method for preoperative localization and qualitative diagnosis of adrenal tumors. According to the updated 2017 American College of Radiology (ACR) white paper and the latest guidelines from the European Society of Endocrinology/European Network for the Study of Adrenal Tumors, incidental adrenal tumors should first undergo non-enhanced CT imaging to determine their CT attenuation values. A threshold of 10 HU is generally selected, where lesions with attenuation values below 10 HU are generally considered benign. For those with values greater than 10 HU, further enhanced CT scans are needed to facilitate classification [12, 13]. Evidence from prior studies has demonstrated that attenuation values may be influenced by equipment parameters such as kVp, which reduce the diagnostic accuracy for adrenal tumors [14]. Moreover, the accuracy of CT is highly dependent on the diagnostic expertise of radiologists, and it cannot accurately differentiate the subtypes of adrenal cortical adenomas. Radiomics provides valuable evidence for early tumor diagnosis, differentiation, clinical decision-making, and prognosis prediction in a convenient and non-invasive manner, surpassing traditional imaging techniques in these aspects.
In this study, we applied CT radiomics methods, as well as preoperative adrenal function tests and postoperative pathological diagnosis, to facilitate ACA classification. Radiomic single-phase models (including unenhanced, arterial, and venous phase models), a triphaic model, a clinico-radiological model, and a clinico-radiological-radiomics model (combine model) were constructed using abdominal enhanced CT images from the unenhanced, arterial, and venous phases, along with the clinico-radiological data. The performance of the six models was compared using metrics such as Receiver Operating Characteristic curve (ROC), Area Under the Curve (AUC), sensitivity, and accuracy. The aim of the study was to predict different types of ACA using a more objective and non-invasive approach, thereby providing data to guide clinical decision-making, help clinicians select appropriate diagnostic and treatment options, and assess the prognosis.
Materials and methods
This retrospective study was approved by the Medical Ethics Committee of the First People’s Hospital of Yunnan Province (No. KHLL2023-KY170) and the Second Affiliated Hospital of Kunming Medical University (No. 2023-233). Given the retrospective nature of the study and use of deidentified data, the ethics committee waived the requirement for informed consent. Tumor segmentation, feature extraction, preprocessing, screening, and classifier model construction were performed on the Darwin Intelligent Medical Research Platform (details and relevant agreements can be found at https://arxiv.org/abs/2009.00908).
Patient selection
Patients who underwent adrenalectomy for adrenal masses and had definitive pathological diagnoses, were treated in the Urology Department of the First People’s Hospital of Yunnan Province (Center One) from January 2016 to June 2023, as well as in the Urology Department of the Second Affiliated Hospital of Kunming Medical University (Center Two) from January 2021 to May 2023, were enrolled in the study. Using the aforementioned criteria, 414 and 669 patients were respectively analyzed. The following inclusion criteria were used: (1) Patients who underwent adrenalectomy for adrenal masses and had definitive pathological diagnoses. (2) Patients who underwent abdominal contrast-enhanced CT imaging within one month before treatment and obtained multi-phase (unenhanced, arterial and venous) images. The exclusion criteria were: (1) Patients not falling under the pathological classification of interest. (2) Those with adrenal masses with a diameter below 1 cm. (3) Patients with poor-quality CT images affecting the image segmentation due to artifacts. (4) Patients with incomplete clinical or imaging data, or those for whom the specific tumor subtype could not be determined. (5) Patients whose hormone levels might be influenced by medication intake.
After analyzing the postoperative pathological results and inclusion/exclusion criteria, 169 patients with ACA were enrolled, with 45 cases from Center One and 124 cases from Center Two. The patients’ blood pressure status and adrenal function test results were also determined [15, 16] (Due to ethnic and regional differences, reference was made to the relevant guidelines and recommendations for adrenal diseases in China. The specific details are presented in Table 1), the 169 adrenal adenoma patients were classified into APA (n = 15/n = 41), CPA (n = 15/n = 34), and clinically NAA (n = 15/n = 49) groups. Subsequently, three predictive models were constructed: APA versus other ACA, CPA versus other ACA, and clinically non-functional adenoma versus other ACA. The data from Center Two served as the internal cohort for the training and validation cohorts (at an 8:2 ratio), while the data from Center One served as an external cohort for testing. Patients’ inclusion and exclusion criteria are depicted in Fig. 1.
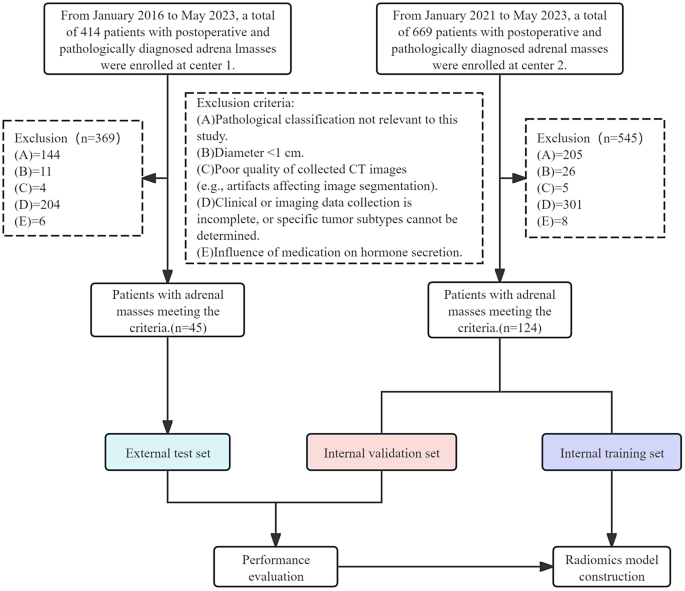
A flowchart showing the patient inclusion and exclusion process
Collection of clinical and routine imaging parameters
The collected clinical parameters of patients included age, sex, tumor laterality, and maximum tumor diameter. Routine imaging parameters included the mean attenuation value, maximum attenuation value, minimum attenuation value, and standard deviation of the mean attenuation value in the unenhanced, venous, and arterial phases, as well as the differences between the mean attenuation values in the venous and arterial phases compared to the unenhanced phase. Besides age, sex, and laterality, all other features were measured using the values obtained from three consecutive transverse CT images of the tumor’s maximum diameter. Each image was measured three times, ensuring that areas with cystic changes or calcification were excluded, and the final value was the average of these measurements.
CT image acquisition and processing
Several multi-slice CT scanners (Brilliance iCT, Philips; SOMATOM Force, SOMATOM Drive, or SOMATOM Perspective, Siemens; Aquilion ONE, Canon) were utilized to perform abdominal contrast-enhanced scanning. The collimation settings were 128 × 0.625, 192 × 0.6, 128 × 0.6, 64 × 0.6, and 100 × 0.5, with a tube voltage range of 80–120 kVp and a matrix size of 512 × 512. The gantry rotation time was 0.5 s, with a pitch range of 0.5-0.993 and a slice thickness varying between 0.9 mm and 5 mm. For Brilliance iCT, the tube current was set at 200–250 mAs, while for the other scanners, it was automatically adjusted. Non-ionic contrast agents, Iohexol Injection or Iomeprol Injection, were administered via the cubital vein at a dosage of 450 mg I/kg, with concentrations of 350 mg I/ml for Iohexol and 400 mg I/ml for Iomeprol. Arterial phase imaging was performed using the threshold-triggering technology, while venous phase imaging was conducted with a fixed delay of 50–70 s. Detailed information on radiation exposure, such as CTDI and DLP [17] are shown in Table S1. At the end of CT scanning, the image data were transferred to the image workstation Picture Archiving and Communication System (PACS) for post-processing, and the data were saved in the Digital imaging and communications in medicine format.
Region of interest segmentation and feature extraction
Semi-automatic segmentation was performed by a urologist with 7 years of experience in urinary system imaging using the Darwin Intelligent Medical Research Platform. To ensure objectivity, the urologist was blinded to all patient clinical information and carefully avoided including the tumor capsule, adrenal gland, and adjacent tissues within the regions of interest. After delineation, another urologist with 17 years of extensive experience in urinary system imaging examined each annotation individually. Any discrepancy between the two urologists was resolved through consultation by a urologist with over 20 years of urinary system imaging experience to determine the final region of interest. Subsequently, radiomic features were automatically extracted from each patient’s images in the unenhance, arterial, and venous phases (The details of feature extraction methods can be obtained from https://arxiv.org/abs/2009.00908).
Feature selection and model construction
To validate the accuracy of tumor ROI delineation, we conducted Dice coefficient analysis and ICC analysis as detailed below:
Thirty patients from the internal cohort were randomly selected based on the classification ratios, and the regions of interest were segmented and features extracted by two urologists: one with 7 years of experience and the other with 17 years of experience in urological imaging. Firstly, the Dice coefficient was calculated from the ROIs delineated by the two experts. The calculation formula is presented below [18]:
Following confirmation of inter-reader reliability, the ICC was calculated using the method described by McGraw and Wong [19] for all features. Features with an ICC value exceeding 0.75 were considered robust and included in subsequent analyses.
Next, the “min-max normalization” method was applied to preprocess the features, whereby each feature dimension of all samples was linearly transformed to the range of (0,1). For each feature\(X \in {R^{N \times d}}\) where N is the total number of samples and d is the feature dimension. Min-max normalization was performed on each column feature \(X \in {R^N}\) as follows:
where1 ≤ i ≤ N, and xmax and xmin are the maximum and minimum element values in x, respectively.
Subsequently, the SelectFromModel algorithm, with SVM as the evaluation model, was utilized to perform the first round of screening for radiomic features.: unenhanced, arterial, and venous phases. Subsequently, feature selection was performed in the second round using the RFECV (Recursive Feature Elimination with Cross-Validation) algorithm (The RFECV algorithm assesses feature importance by iteratively removing the least important features after each training iteration. This process continues until the classification performance begins to decline or the minimum number of features is reached, based on the LASSO model, to obtain the final robust radiomics features. Triphasic radiomics features were generated by combining radiomic features extracted from unenhanced, arterial, and venous phase images. Subsequently, a logistic regression classification model was developed using these combined radiomics features. The selection of clinico-radiological features was based on inter-group comparisons using data from the training set. Features with statistical significance (P < 0.05) were enrolled in the final analysis. Separate models for clinico-radiological features were constructed and combined with the optimal radiomics model to establish a joint model. Finally, external data were utilized to test the generalizability of this model. The overall workflow of the radiomics analysis is presented in Fig. 2.

Radiomics analysis workflow diagram
Statistical analysis
Statistical analysis was conducted using the SPSS 26.0 software. Categorical data were compared between the groups using Pearson’s chi-square test. For continuous variables that followed a normal distribution and exhibited homogeneity of variances, one-way analysis of variance (ANOVA) was applied. The results are expressed as the mean ± standard deviation. For data that did not follow a normal distribution or exhibited heterogeneity of variances, as well as intergroup comparisons, the non-parametric Kruskal-Wallis H test was utilized, and the results were expressed as the median and interquartile range. A P < 0.05 was considered statistically significant.
The Receiver Operating Characteristic curve (ROC) analysis and its calculated Area Under the Curve (AUC), sensitivity, specificity, precision, and accuracy was employed to assess the predictive performance of the model. External data were employed for external testing to further evaluate the generalizability of the model.
Results
Comparison of clinico-radiological features among the three patient groups
A total of 169 patients were enrolled from two centers, with 45 cases from Center One and 124 cases from Center Two. Patients from Center Two were assigned to the internal data group with 99 cases in the training set (including 39 APA, 27 CPA, and 33 clinically non-functional adenomas) and 25 cases in the validation set (including 10 APA, 7 CPA, and 8 clinically non-functional adenomas). Patients from Center One were designated as the external testing set (comprising 15 cases each of APA, CPA, and clinically non-functional adenomas). Although significant differences were observed between the three patient groups in baseline characteristics, including the standard deviation of attenuation values in the arterial phase, the standard deviation of attenuation values in the venous phase, and the difference in attenuation values between the venous phase and the unenhanced phase (Table 2). However, these three features were not significantly different in the subsequent three-class classification analysis of the training set (Table 3) and were not included in the final model.
Extraction of radiomic features and optimal feature selection
Table S2 presents the Dice similarity coefficients obtained from the analysis. A total of 5343 features were extracted, including 1781 features from each unenhanced, arterial, and venous phase images using an intelligent medical research platform. Following the ICC analysis, 4830 robust features (ICC > 0.75) with 1583 from the unenhanced, 1621 from the arterial, and 1626 from the venous. In the first round of feature selection for each radiomics model, the aforementioned features were incorporated, leading to the selection of 102, 13, and 17 features for the unenhanced, arterial, and venous phases, respectively.
This procedure was repeated in a second round of selection. The final number of optimal features selected for the three phases were 13, 4, and 10, respectively. Results of the clinico-radiological features for the training set are shown in Table 3. Significant features (P < 0.05) were included in the final modeling. The results indicated that the triphasic model had the best performance among the radiomics models. The selected clinico-radiological features were combined with the triphasic radiomics features to establish a combination model. The optimal number, types, and weights of features for the six models are shown in Fig. 3.

The optimal feature types and feature weights of the unenhanced phase, arterial phase, venous phase, clinico-radiological, triphasic, and combine models
Performance of the six models
The ROC curves and AUCs for the training and validation sets are presented in Fig. 4. Results of the sensitivity, specificity, precision, and accuracy values are listed in Table 4. The confusion matrices for the six models are illustrated in Fig. 5. AUC values for distinguishing APA from other adenomas, CPA from other adenomas, and NAA from other adenomas for the training and validation set were as follows: training set and validation set AUC were (0.95, 95% CI = 0.90–0.99; 0.93, 95% CI = 0.83–1.00); (0.96, 95% CI = 0.93–1.00; 0.89, 95% CI = 0.72–1.00); (0.94, 95% CI = 0.90–0.98; 0.77, 95% CI = 0.55–1.00), respectively. The results indicated that the combined model achieved the best predictive performance for APA and NAA, while the AUC for distinguishing CPA in the external validation set was relatively lower compared with that of the clinico-radiological model.

ROC curves for classifying the prediction results of the three types of adrenal cortical adenomas in the internal training and validation sets. a-c The ROC curves for discriminating APA, CPA, and NAA in the four-phase models of the internal training set. d-f The ROC curves for discriminating APA, CPA, and NAA in the four-phase models of the internal validation set

Confusion matrix based on internal data training and validation results
The AUC results for the external data are shown in Fig. 6. Notably, the AUCs of the joint model for distinguishing APA from other adenomas, CPA from other adenomas, and NAA from other adenomas were (0.86, 95% CI = 0.73–0.99), (0.89, 95% CI = 0.80–1.00), and (0.82, 95% CI = 0.68–0.95), respectively. External data further validated the results obtained from the internal data. The confusion matrix for the optimal model is presented in Fig. 7, and its sensitivity, specificity, precision, and accuracy are detailed in Table 4.

ROC curves of classification prediction results for the three types of adrenal cortical adenomas in the external test set. a-c The ROC curves for discriminating APA, CPA, and NAA in the four-phase models of the internal training set

Confusion matrix based on external data test results
Discussion
In recent years, the incidence and detection rate of AI have been on the increase, with approximately 90% of cases being ACA. Among them, functional adenomas are a significant threat to patients’ life and health, most of them requiring surgical intervention. However, most preoperative examination protocols are costly, cause significant trauma, and not sufficiently accurate, which limit their application in the preoperative diagnosis of adrenal tumors. Therefore, innovative preoperative diagnostic methods need to be developed to improve the diagnosis of adrenal tumors. This study found that the combination models based on logistic regression can accurately predict the preoperative multi-classification of adrenal tumors, as evidenced by their performance in the external test set.
Previous studies have demonstrated radiomic models can effectively classify the diagnosis of adrenal tumors. For instance, Chen et al. [20] utilized CT radiomic models to differentiate non-functional adenomas from APA and to predict their prognosis. The results suggest that CT-based radiomic models are ideal for distinguishing between APA and non-functional adenomas detected in CT imaging among hypertensive patients in clinical practice. Piskin et al. [21] developed a radiomics and clinical feature model using MRI data to differentiate between non-functional and autonomously secreting cortisol adrenal incidentalomas. They found that the radiomics models (OP, IP, IP plus T2-W model) showed superior performance in the training and testing datasets. Another study by Qi et al. [22] applied various radiomics classifiers to analyze functional and non-functional ACA. They reported that the radiomics model based on the logistic regression achieved the best performance.
However, most previous studies on adrenal radiomics did not include an external validation cohort and did not address the differential prediction of the models between two categories within the three classifications of adrenal adenomas. Moreover, the studies did not comprehensively evaluate the efficacy of any classifier model in accurately distinguishing between all three subtypes of adrenal adenomas. Furthermore, treatment strategies, preoperative preparation, and the timing of postoperative hormone replacement therapy vary significantly depending on the specific adenoma subtype. Therefore, a predictive model that can comprehensively predict all subtypes of adrenal adenomas needs to be developed. In addition, the three-class radiomics prediction model faces greater variability as the number of classifications increases. This increased complexity can decrease the model performance, presenting a significant challenge in enhancing the effectiveness of the model [23]. In this study, we validated the performance of the model in an external cohort, performed classification and differential prediction for all types of adrenal adenomas. The results indicated that the model could distinguish the three categories of adrenal adenomas with good generalizability. These findings may serve as a reference value for making treatment decisions and perioperative planning for patients.
Further analysis revealed that the three-class prediction model for adrenal adenomas outperformed or was comparable to that of previous studies in differentiating all three types of ACA [20,21,22, 24, 25]. Furthermore, we observed that the triphasic model exhibited the best performance among the radiomics models, which is in line with the findings of Qi et al. [22]. Moreover, we applied the same model to extract identical features within each imaging phase (unenhanced, arterial, and venous) for the purpose of differentiating between the three adenoma subtypes. Although this may potentially decrease the model efficacy, considering the universality and simplicity required for future clinical applications, our approach carries significant advantages.
This study demonstrated that in the combined model, age carried the greatest weight, including the inclusion of sex and tumor size. This is consistent with the findings by Oksana et al. [26], who suggested that these features are associated with the adrenal ACA subtypes. Cristina et al. [8] uncovered that the tumor diameter and mean attenuation value in the venous phase can effectively distinguish CPA. In contrast, Chan et al. [27] reported that tumor size, mean attenuation value in the unenhanced phase, and mean attenuation value in the enhanced phase can facilitate the differentiation of CPA. Among the radiomics features, the 10th percentile and Gray-Level Co-occurrence Matrix (GLCM) features exerted significant weights and proportions. The Gray-Level Co-occurrence Matrix (GLCM), as a classical texture analysis method, reveals the spatial distribution and variability of image textures by statistically analyzing the distribution of gray levels in adjacent pixel pairs. This feature descriptor plays an important role in tasks such as tumor segmentation, lesion detection, and tissue classification in the field of image processing. Percentiles, as an intuitive statistical measure, describe the value corresponding to a specific percentage of data points within a dataset. This value represents the gray level below which 10% of the pixels in an image fall, indicating the distribution of low-intensity regions within the image. Previous studies [28] have suggested that APA contained clear cells or dense eosinophilic cells or a combination of both. On the contrary, CPA consists of enlarged “balloon-like” cells with increased lipid accumulation in the cytoplasm. The Grey level co-occurrence matrix feature generally indicates grayscale relationships between pixels in image maps, reflecting tissue structure and complexity, which is closely associated with the cellular composition of the aforementioned tumors. Chan et al. [27] demonstrated that CPA may manifest as relatively large and high-density masses on CT scans, while APA may appear as relatively small and low-density masses. The 10 percentile typically reflects the distribution of grayscale and brightness pixels in image maps, and in CT images, grayscale and brightness reflect tumor density. In the statistical analysis of tumor maximum diameter, our results were consistent with those of the aforementioned studies. Moreover, others scholars [27, 29] found that the pathological morphology of APA and non-functioning adrenal ACA are similar. However, the CT manifestations of functional and non-functional adenomas may exhibit significant overlap. Therefore, this may explain the relatively lower discriminatory performance of the model in identifying NAA.
This study has several limitations: (1) Although we performed external validation, the results obtained may be limited by the small sample size and retrospective nature of the study. Future research should involve larger sample sizes, multicenter studies, and prospective designs to validate the present findings. (2) Some patients did not undergo gold-standard diagnostic tests due to various constraints and patient preferences. Consequently, we included as many classification criteria as possible, which led to the exclusion of many patients. However, the occurrence of false-negative results remains unavoidable. (3) This study utilized a single classifier model for validation. Future research should perform model training and exploration of more models to achieve optimal prediction results. (4) In the present study, we included only adrenal tumors with a diameter exceeding 1 cm, consistent with the commonly accepted definition of adrenal incidentalomas. Therefore, further research may be necessary to investigate tumors smaller than 1 cm.
Conclusion
The logistic regression classifier model, incorporating both clinico-radiological and radiomic features, proves to be effective in distinguishing adrenal adenoma subtypes. As a non-invasive preoperative diagnostic tool, it holds substantial promise for future clinical applications.
Data availability
The datasets used and/or analysed during the current study are available from the corresponding author on reasonable request.
Abbreviations
- ACA:
-
Adrenocortical adenomas
- AI:
-
Adrenal incidentaloma
- APA:
-
Aldosterone-producing adenoma
- ARR:
-
Aldosterone/renin ratio
- AUC:
-
Area under the curve
- CPA:
-
Cortisol-producing adenoma
- GLCM:
-
Gray-LevelCo-occurrence Matrix
- ICC:
-
Inter-correlation coefficient
- NAA:
-
Non-functioning adrenal adenoma
- PACS:
-
Picture archiving and communication system
- RFECV:
-
Recursive Feature Elimination with Cross-Validation
- ROC:
-
Receiver operating characteristic curve
References
Song JH, Chaudhry FS, Mayo-Smith WW. The incidental adrenal mass on CT: prevalence of adrenal disease in 1,049 consecutive adrenal masses in patients with no known malignancy. AJR Am J Roentgenol. 2008;190(5):1163–8.
Ebbehoj A, Li D, Kaur RJ, Zhang C, Singh S, Li T, et al. Epidemiology of adrenal tumours in Olmsted County, Minnesota, USA: a population-based cohort study. Lancet Diabetes Endocrinol. 2020;8(11):894–902.
Abecassis M, McLoughlin MJ, Langer B, Kudlow JE. Serendipitous adrenal masses: prevalence, significance, and management. Am J Surg. 1985;149(6):783–8.
Hammarstedt L, Muth A, Wängberg B, Björneld L, Sigurjónsdóttir HA, Götherström G, et al. Adrenal lesion frequency: a prospective, cross-sectional CT study in a defined region, including systematic re-evaluation. Acta Radiol. 2010;51(10):1149–56.
Jing Y, Hu J, Luo R, Mao Y, Luo Z, Zhang M, et al. Prevalence and characteristics of adrenal tumors in an unselected Screening Population: a cross-sectional study. Ann Intern Med. 2022;175(10):1383–91.
Mete O, Erickson LA, Juhlin CC, de Krijger RR, Sasano H, Volante M, et al. Overview of the 2022 WHO classification of adrenal cortical tumors. Endocr Pathol. 2022;33(1):155–96.
Fassnacht M, Tsagarakis S, Terzolo M, Tabarin A, Sahdev A, Newell-Price J, et al. European Society of Endocrinology clinical practice guidelines on the management of adrenal incidentalomas, in collaboration with the European Network for the study of adrenal tumors. Eur J Endocrinol. 2023;189(1):G1–42.
Mosconi C, Vicennati V, Papadopoulos D, Dalmazi GD, Morselli-Labate AM, Golfieri R, et al. Can Imaging predict subclinical cortisol secretion in patients with adrenal adenomas? A CT predictive score. AJR Am J Roentgenol. 2017;209(1):122–9.
Corwin MT, Lan C, Wilson M, Loehfelm TW, Campbell MJ. Can abdominal CT features predict autonomous cortisol secretion in patients with adrenal nodules? Abdom Radiol (NY). 2021;46(9):4338–44.
Park SY, Oh YT, Jung DC, Rhee Y. Prediction of adrenal adenomas with hypercortisolism by using adrenal computed tomography: emphasis on contralateral adrenal thinning. J Comput Assist Tomogr. 2015;39(5):741–6.
Fassnacht M, Arlt W, Bancos I, Dralle H, Newell-Price J, Sahdev A, et al. Management of adrenal incidentalomas: European Society of Endocrinology Clinical Practice Guideline in collaboration with the European Network for the study of adrenal tumors. Eur J Endocrinol. 2016;175(2):G1–34.
Buitenwerf E, Berends AMA, van Asselt ADI, Korteweg T, Greuter MJW, Veeger NJM, et al. Diagnostic accuracy of computed tomography to Exclude Pheochromocytoma: a systematic review, Meta-analysis, and cost analysis. Mayo Clin Proc. 2019;94(10):2040–52.
Mayo-Smith WW, Song JH, Boland GL, Francis IR, Israel GM, Mazzaglia PJ, et al. Management of incidental adrenal masses: a White Paper of the ACR Incidental findings Committee. J Am Coll Radiol. 2017;14(8):1038–44.
Bonatti M, Valletta R, Corato V, Oberhofer N, Piffer S, Vingiani V et al. Impact of different peak tube voltage settings on adrenal adenomas attenuation at unenhanced CT. Eur Radiol.2024.
Kebebew E. Adrenal incidentaloma. N Engl J Med. 2021;384(16):1542–51.
Li LL, Dou JT. How to Select Subclinical Cushing’s Syndrome from Adrenal Incidentaloma. CHINESE JOURNAL OF PRACTICAL INTERNAL MEDICINE.2017; 37(10):867–70.
Quality Management and Safety Management Subgroup, Radiology Branch of the Chinese Medical Association. (2017) Experts consensus on diagnostic reference level of CT radiation dose.2017; 51(11):817–822.
Sudre CH, Li W, Vercauteren T, Ourselin S, Jorge Cardoso M. Generalised Dice Overlap as a Deep Learning Loss Function for Highly Unbalanced Segmentations. Deep Learn Med Image Anal Multimodal Learn Clin Decis Support (2017).2017; 2017:240–248.
Wang G, Kang B, Cui J, Deng Y, Zhao Y, Ji C, et al. Two nomograms based on radiomics models using triphasic CT for differentiation of adrenal lipid-poor benign lesions and metastases in a cancer population: an exploratory study. Eur Radiol. 2023;33(3):1873–83.
Chen PT, Chang D, Liu KL, Liao WC, Wang W, Chang CC, et al. Radiomics utilization to differentiate nonfunctional adenoma in essential hypertension and functional adenoma in primary aldosteronism. Sci Rep. 2022;12(1):8892.
Piskin FC, Akkus G, Yucel SP, Unal I, Balli HT, Olgun ME, et al. A machine learning approach to distinguishing between non-functioning and autonomous cortisol secreting adrenal incidentaloma on magnetic resonance imaging using texture analysis. Ir J Med Sci. 2023;192(3):1155–61.
Qi S, Zuo Y, Chang R, Huang K, Liu J, Zhang Z. Using CT radiomic features based on machine learning models to subtype adrenal adenoma. BMC Cancer. 2023;23(1):111.
Zheng S, Yang Z, Du G, Zhang Y, Jiang C, Xu T et al. Discrimination between HER2-overexpressing, -low-expressing, and -zero-expressing statuses in breast cancer using multiparametric MRI-based radiomics. Eur Radiol.2024;34(9):6132-6144.
Zheng Y, Liu X, Zhong Y, Lv F, Yang H. A preliminary study for Distinguish hormone-secreting functional adrenocortical adenoma subtypes using multiparametric CT Radiomics-based machine learning model and Nomogram. Front Oncol. 2020;10:570502.
Yang W, Hao Y, Mu K, Li J, Tao Z, Ma D et al. Application of a Radiomics Machine Learning Model for differentiating aldosterone-producing adenoma from non-functioning adrenal adenoma. Bioeng (Basel).2023; 10(12).
Hamidi O, Shah M, Zhang CD, Lazik N, Li D, Singh S, et al. Clinical and imaging presentations are associated with function in incidental adrenocortical adenomas: a retrospective cohort study. Eur J Endocrinol. 2024;191(1):47–54.
Kim CK, Kang KA, Oh YL, Park SY. Role of computed tomography in predicting adrenal adenomas with cortisol hypersecretion. Br J Radiol. 2023;96(1149):20221032.
Lack EE. Tumors of the adrenal glands and extraadrenal paraganglia. American Registry of Pathology; 2007.
Yang Y, Xiao M, Song Y, Tang Y, Luo T, Yang S, et al. H-score of 11β-hydroxylase and aldosterone synthase in the histopathological diagnosis of adrenocortical tumors. Endocrine. 2019;65(3):683–91.
Acknowledgements
The extraction of radiomics features and the establishment of the radiomics model were supported by the Darwin Research Platform.
Funding
This work was supported by the Medical leading talents Project in Yunnan Province (grant numbers L-2019016) and the Yunnan Province High-level personnel training support Program famousMedical Project (grant numbers YNWR-MY-2020-035).
Author information
Authors and Affiliations
Contributions
All authors contributed to the conception, design, and supervision of the project. LW and WJF led and coordinated the study. SYP and HPP collected data from Center 1; SX and YML collected data from Center 2. LJJ annotated the CT images, and YML and LW carefully reviewed the annotated data. Clinical data review and statistical analysis were performed by ZYW and ZY. With suggestions and research services for feature engineering and model design provided by LH and CJQ. ZXZ and YLY preprocessed all the data, analyzed the image features, and constructed the radiomics model. ZXZ and SYP were the main contributors to manuscript writing. YJF provided constructive suggestions for the study. SW, ZJP, and LWL provided significant assistance in revising the manuscript. All authors have reviewed, edited, and approved the final version of the manuscript.
Corresponding authors
Ethics declarations
Ethics approval and consent to participate
This study is a retrospective study and has been approved by the Medical Ethics Committee of the First People’s Hospital of Yunnan Province (No. KHLL2023-KY170) and the Second Affiliated Hospital of Kunming Medical University (No. 2023 − 233). Due to retrospective and anonymous analysis, the ethics committee waived the requirement for informed consent.
Consent for publication
Not applicable.
Clinical trial number
Not applicable.
Competing interests
The authors declare no competing interests.
Additional information
Publisher’s note
Springer Nature remains neutral with regard to jurisdictional claims in published maps and institutional affiliations.
Electronic supplementary material
Below is the link to the electronic supplementary material.
Rights and permissions
Open Access This article is licensed under a Creative Commons Attribution-NonCommercial-NoDerivatives 4.0 International License, which permits any non-commercial use, sharing, distribution and reproduction in any medium or format, as long as you give appropriate credit to the original author(s) and the source, provide a link to the Creative Commons licence, and indicate if you modified the licensed material. You do not have permission under this licence to share adapted material derived from this article or parts of it. The images or other third party material in this article are included in the article’s Creative Commons licence, unless indicated otherwise in a credit line to the material. If material is not included in the article’s Creative Commons licence and your intended use is not permitted by statutory regulation or exceeds the permitted use, you will need to obtain permission directly from the copyright holder. To view a copy of this licence, visit http://creativecommons.org/licenses/by-nc-nd/4.0/.
About this article

Cite this article
Zhang, X., Si, Y., Shi, X. et al. Differentiation of multiple adrenal adenoma subtypes based on a radiomics and clinico-radiological model: a dual-center study. BMC Med Imaging 25, 45 (2025). https://doiorg.publicaciones.saludcastillayleon.es/10.1186/s12880-025-01556-w
Received:
Accepted:
Published:
DOI: https://doiorg.publicaciones.saludcastillayleon.es/10.1186/s12880-025-01556-w